Rereading The Mythical Man-Month
The book The Mythical Man-Month by Fred Brooks, first published in 1975, continues to be widely referenced, my 1995 edition cites over 250K copies in print. In the past I have found it to be a pleasant, relatively content free, read.
Having spent some time analyzing computing data from the 1960s, I thought it would be interesting to reread Brooks in the light of what I had recently learned. I cannot remember when I last read the book, and only keep a copy to be able to check when others cite it as a source.
Each of the 15 chapters, in the 1975 edition, takes the form of a short five/six page management briefing on some project related topic; chapters start with a picture of some work or art on one page, and a short quote from a famous source occupies the opposite page. The 20th anniversary edition adds four chapters, two of which ‘refire’ Brooks’ 1986 paper introducing the term No Silver Bullet (that no single technlogy will produce an order of magnitude improvement in productivity).
Rereading, I found the 1975 contents to be sufficiently non-specific that my newly acquired knowledge did not change anything. It was a pleasant read, various ideas and some data points are presented, the work of others is covered and cited, a few points are briefly summarised and the chapter ends. The added chapters have a different character than the earlier ones, being more detailed in their discussion and more specific in suggesting outcomes. The ‘No Silver Bullet’ material dismisses some of the various claimed discoveries of a silver bullet.
Why did the book sell so well?
The material is an easy read, and given that no solutions are heavily pushed, there is little to disagree with.
Being involved on a project for the first time can be a confusing experience, and even more experienced people get lost. Brooks can provide solace through his calm presentation of project behaviors as stuff that happens.
What project experience did Brooks have?
Brooks’ PhD thesis The Analytic Design of Automatic Data Processing Systems was completed in 1956, and, aged 25, he joined IBM that year. He was project manager for System/360 from its inception in late 1961 to its launch in April 1964. He managed the development of the operating system OS/360 from February 1964, for a year, before leaving to found the computer science department at the University of North Carolina at Chapel Hill, where he remained.
So Brooks gained a few years of hands-on experience at the start of his career and spent the rest of his life talking about it. A not uncommon career path.
Managing the development of an O/S intended to control a machine containing 16K of memory (i.e., IBM’s System/360 model 30) might not seem like a big deal. Teams of half-a-dozen good people had implemented projects like this since the 1950s. However, large companies create large teams, operating over multiple sites, with every changing requirements and interfaces, changing hardware, all with added input from marketing (IBM was/is a sales-driven organization). I suspect that the actual coding effort was a rounding error, compared to the time spent in meetings and on telephone calls.
Brooks looked after the management, and Gene Amdahl looked after the technical stuff (for lots of details see IBM’s 360 and early 370 systems by Pugh, Johnson, and Palmer).
Brooks was obviously a very capable manager. Did the O/360 project burn him out?
Analyzing mainframe data in light of the IBM antitrust cases
Issues surrounding the decades of decreasing cost/increasing performance of microcomputers, powered by Intel’s x86/Pentium have been extensively analysed. There has been a lot of analysis of pre-Intel computers, in particular Mainframe computers. Is there any major difference?
Mainframes certainly got a lot faster throughout the 1960s and 1970s, and the Computer and Automation’s monthly census shows substantial decreases in rental prices (the OCR error rate is not yet low enough for me to be willing to spend time extracting 300 pages of tabular data).
During the 1960s and 1970s the computer market was dominated by IBM, whose market share was over 70% (its nearest rivals, Sperry Rand, Honeywell, Control Data, General Electric, RCA, Burroughs, and NCR, were known as the seven dwarfs).
While some papers analyzing the mainframe market do mention that there was an antitrust case against IBM, most don’t mention it. There are some interesting papers on the evolution of families of IBM products, but how should this analysis be interpreted in light of IBM’s dominant market position?
For me, the issue of how to approach the interpretation of IBM mainframe cost/performance/sales data is provided by the book The U.S. Computer Industry: A Study of Market Power by Gerald Brock.
Brock compares the expected performance of a dominant company in a hypothetical computer industry, where anticompetitive practices do not occur, with IBM’s performance in the real world. There were a variety of mismatches (multiple antitrust actions have found IBM guilty of abusing its dominant market power).
Any abuse of market power by IBM does not impact the analysis of computer related issues about what happened in the 1950s/1960s/1970, but the possibility of this behavior introduces uncertainty into any analysis of why things happened.
Intel also had its share of antitrust cases, which will be of interest to people analysing the x86/Pentium compatible processor market.
Evidence-based Software Engineering book: the last year
It’s now three years since my book, Evidence-based Software Engineering: based on the publicly available data, was released. What has happened in the last year, since I wrote about the first two years, and what might happen in the next year or so?
There is now a Discord channel for discussing evidence-based software engineering. Blog readers and anyone with an interest in the subject are most welcome.
I keep a copy of software related papers that I think might be worth looking at again, and have been meaning to make this list public. A question by ysch, a Discord channel member, asked after ways of checking whether a software paper was worth reading. This prompted me to create a Github repo containing the titles of these 7,756 saved papers, along with some data related annotations. On the more general question of paper quality, my view is that most papers are not worth reading, with a few being very well worth reading. People have to develop techniques for rapidly filtering out the high volume of drivel; techniques I use, and understanding the publication ecosystem.
This last year saw the sudden arrival of a new tool, LLMs. My experience with using ChatGPT (and other such LLMs) as an evidence-based research tool is that the answers are too generic or just plain wrong (for several months, one LLM reported that I had a degree in Divinity Studies). If I was writing a book, I suspect that they would provide a worthwhile copy-editing service.
I was hoping that the recently released GPT-4 vision model would do high quality text extraction from scanned pdfs, but the quality of output I have received is about the same as traditional OCR-based tools. I expect that the data extraction ability LLM based tools will get a lot better, because they are at the start of the learning curve and there is a commercial incentive for them to be a lot better.
An LLM is driven by the token weights learned during training. Roughly speaking, the more training data on a topic, the larger the trained weights for that topic. There is not a lot of data (i.e., text) relating to evidence-based software engineering, compared to the huge quantities available for some topics, so responses are generic and often parrot established folklore. The following image was generated by DALL-E3:

There is a tale of software product evolution waiting to be told via the data contained in magazine adverts; the magazines are on bitsavers, we just need LLMs to be good enough to reliably extract advert contents (currently, too many hallucinations).
The book contents continue to survive almost completely unscathed, primarily because reader feedback continues to be almost non-existent. Despite the close to 500k downloads (now averaging 4k-5k downloads per month, from the logs I have, with the mobile friendly version around 10%), most people I meet have not heard of the book. The concept of an evidence-based approach to software engineering continues to be met with blank looks, although a commonly cited listener use case for the book’s data is validating a pet theory (my suggestion that the data may show their pet theory to be wrong is not appreciated).
Analysis/data in the following blog posts, from the last 12-months, belongs in the book in some form or other:
Some human biases in conditional reasoning
Unneeded requirements implemented in Waterfall & Agile
Analysis of Cost Performance Index for 338 projects
Evaluating Story point estimation error
Frequency of non-linear relationships in software engineering data
Analysis of when refactoring becomes cost-effective
An evidence-based software engineering book from 2002
Perturbed expressions may ‘recover’
Predicting the size of the Linux kernel binary
Local variable naming: some previously unexplored factors
Optimal function length: an analysis of the cited data
Some data on the size of Cobol programs/paragraphs
Hardware/Software cost ratio folklore
Criteria for increased productivity investment
Likelihood of encountering a given sequence of statements
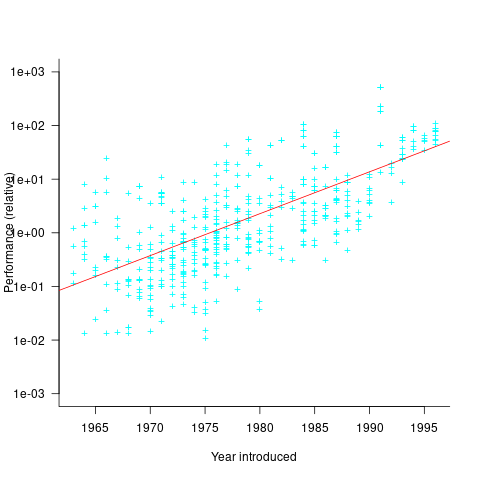
Relative performance of computers from the 1950s/60s/70s
What was the range of performance of computers introduced in the 1950, 1960s and 1970s, and what was the annual rate of increase?
People have been measuring computer performance since they were first created, and thanks to the Internet Archive the published results are sometimes available today. The catch is that performance was often measured using different benchmarks. Fortunately, a few benchmarks were run on many systems, and in a few cases different benchmarks were run on the same system.
I have found published data on four distinct system performance estimation models, with each applied to 100+ systems (a total of 1,306 systems, of which 1,111 are unique). There is around a 20% overlap between systems across pairs of models, i.e., multiple models applied to the same system. The plot below shows the reported performance for pairs of estimates for the same system (code+data):

The relative performance relationship between pairs of different estimation models for the same system is linear (on a log scale).
Each of the models aims to produce a result that is representative of typical programs, i.e., be of use to people trying to decide which system to buy.
- Kenneth Knight built a structural model, based on 30 or so system characteristics, such as time to perform various arithmetic operations and I/O time; plugging in the values for a system produced a performance estimate. These characteristics were weighted based on measurements of scientific and commercial applications, to calculate a value that was representative of scientific or commercial operation. The Knight data appears in two magazine articles analysing systems from the 1950s and 1960s (the 310 rows are discussed in an earlier post), and the 1985 paper “A functional and structural measurement of technology”, containing data from the late 1960s and 1970s (120 rows),
- Ein-Dor and Feldmesser also built a structural model, based on the characteristics of 209 systems introduced between 1981 and 1984,
- The November 1980 Datamation article by Edward Lias lists what he called the KOPS (thousands of operations per second, i.e., MIPS for slower systems) value for 237 systems. Similar to the Knight and Ein-dor data, the calculated value is based on weighting various cpu instruction timings
- The Whetstone benchmark is based on running a particular program on a system, and recording its performance; this benchmark was designed to be representative of scientific and engineering applications, i.e., floating-point intensive. The design of this benchmark was the subject of last week’s post. I extracted 504 results from Roy Longbottom’s extensive collection of Whetstone results going back to the mid-1960s.
While the Whetstone benchmark was originally designed as an Algol 60 program that was representative of scientific applications written in Algol, only 5% of the results used this version of the benchmark; 85% of the results used the Fortran version. Fitting a regression model to the data finds that the Fortran version produced higher results than the Algol 60 version (which would encourage vendors to use the Fortran version). To ensure consistency of the Whetstone results, only those using the Fortran benchmark are used in this analysis.
A fifth dataset is the Dhrystone benchmark followed in the footsteps of the Whetstone benchmark, but targetting integer-based applications, i.e., no floating-point. First published in 1984, most of the Dhrystone results apply to more recent systems than the other benchmarks. This code+data contains the 328 results listed by the Performance Database Server.
Sometimes slightly different system names appear in the published results. I used the system names appearing in the Computers Models Database as the definitive names. It is possible that a few misspelled system names remain in the data (the possible impact is not matching systems up across models), please let me know if you spot any.
What is the best statistical technique to use to aggregate results from multiple models into a single relative performance value?
I came up with various possibilities, none of which looked that good, and even posted a question on Cross Validated (no replies yet).
Asking on the Evidence-based software engineering Discord channel produced a helpful reply from Neal Fultz, i.e., use the random effects model: lmer(log(metric) ~ (1|System)+(1|Bench), data=Sall_clean) ; after trying lots of other more complicated approaches, I would probably have eventually gotten around to using this approach.
Does this random effects model produce reliable values?
I don’t have a good idea how to evaluate the fitted model. Looking at pairs of systems where I know which is faster, the relative model values are consistent with what I know.
A csv of the calculated system relative performance values. I have yet to find a reliable way of estimating confidence bounds on these values.
The plot below shows the performance of systems introduced in a given year, on a relative scale, red line is a fitted exponential model (a factor of 5.5 faster, annually; code+data):
If you know of a more effective way of analysing this data, or any other published data on system benchmarks for these decades, please let me know.
Design of the Whetstone benchmark
The Whetstone benchmark was once a widely cited measure of computer performance. This benchmark consisted of a single program, originally designed for Algol 60 based applications, and later translated to other languages (over 85% of published results used Fortran). The source used as representative of typical user programs came from scientific applications, which has some characteristics that are very non-representative of non-scientific applications, e.g., use of floating-point, and proportionally more multiplications and multidimensional array accesses. Dhrystone benchmark was later designed with the intent of being representative of a broader range of applications.
While rooting around for Whetstone result data, I discovered the book Algol 60 Compilation and Assessment by Brian Wichmann. Despite knowing Brian for 25 years and being very familiar with his work on compiler validation, I had never heard of this book (Knuth’s An Empirical Study of Fortran Programs has sucked up all the oxygen in this niche).
As expected, this 1973 book has a very 1960s model of cpu/compiler behavior, much the same as MIX, the idealised computer used by Knuth for the first 30-years of The Art of Computer Programming.
The Whetstone world view is of a WYSIWYG compiler (i.e., each source statement maps to the obvious machine code), and cpu instructions that always take the same number of clock cycles to execute (the cpu/memory performance ratio had not yet moved far from unity, for many machines).
Compiler optimization is all about trying not to generate code, and special casing to eke out many small savings; post-1970 compilers tried hard not to be WYSIWYG. Showing compiler correctness is much simplified by WYSIWIG code generation.
Today, there are application domains where the 1960s machine model still holds. Low power embedded systems may have cpu/memory performance ratios close to unity, and predictable instruction execution times (estimating worst-case execution time is a minor research field).
Creating a representative usage-based benchmark requires detailed runtime data on what the chosen representative programs are doing. Brian modified the Whetstone Algol interpreter to count how many times each virtual machine op-code was executed (see the report Some Statistics from ALGOL Programs for more information).
The modified Algol interpreter was installed on the KDF9 at the National Physical Laboratory and Oxford University, in the late 1960s. Data from 949 programs was collected; the average number of operations per program was 152,000.
The op-codes need to be mapped to Algol statements, to create a benchmark program whose compiled form executes the appropriate proportion of op-codes. Some op-code sequences map directly to statements, e.g., Ld addrof x, Ld value y, Store, maps to the statement: x:=y;.
Counts of occurrences of each language construct in the source of the representative programs provides lots of information about the proportions of the basic building blocks. It’s ‘just’ a matter of sorting out the loop counts.
For me, the most interesting part of the book is chapter 2, which attempts to measure the execution time of 40+ different statements running on 36 different machines. The timing model is  , where
  is the
  ‘th statement,
  is the
  ‘th machine,
  an adjustment factor intended to be as close to one as possible, and
  is execution time. The book lists some of the practical issues with this model, from the analysis of timing data from current machines, e.g., the impact of different compilers, and particular architecture features having a big performance impact on some kinds of statements.
The table below shows statement execution time, in microseconds, for the corresponding computer and statement (* indicates an estimate; the book contains timings on 36 systems):
ATLAS MU5 1906A RRE Algol 68 B5500 Statement 6.0 0.52 1.4 14.0 12.1 x:=1.0 6.0 0.52 1.3 54.0 8.1 x:=1 6.0 0.52 1.4 *12.6 11.6 x:=y 9.0 0.62 2.0 23.0 18.8 x:=y + z 12.0 0.82 3.2 39.0 50.0 x:=y × z 18.0 2.02 7.2 71.0 32.5 x:=y/z 9.0 0.52 1.0 8.0 8.1 k:=1 18.0 0.52 0.9 121.0 25.0 k:=1.0 12.0 0.62 2.5 13.0 18.8 k:=l + m 15.0 1.07 4.9 75.0 35.0 k:=l × m 48.0 1.66 6.7 45.0 34.6 k:=l ÷ m 9.0 0.52 1.9 8.0 11.6 k:=l 6.0 0.72 3.1 44.0 11.8 x:=l 18.0 0.72 8.0 122.0 26.1 l:=y 39.0 0.82 20.3 180.0 46.6 x:=y ^ 2 48.0 1.12 23.0 213.0 85.0 x:=y ^ 3 120.0 10.60 55.0 978.0 1760.0 x:=y ^ z 21.0 0.72 1.8 22.0 24.0 e1[1]:=1 27.0 1.37 1.9 54.0 42.8 e1[1, 1]:=1 33.0 2.02 1.9 106.0 66.6 e1[1, 1, 1]:=1 15.0 0.72 2.4 22.0 23.5 l:=e1[1] 45.0 1.74 0.4 52.0 22.3 begin real a; end 96.0 2.14 80.0 242.0 2870.0 begin array a[1:1]; end 96.0 2.14 86.0 232.0 2870.0 begin array a[1:500]; end 156.0 2.96 106.0 352.0 8430.0 begin array a[1:1, 1:1]; end 216.0 3.46 124.0 452.0 13000.0 begin array a[1:1, 1:1, 1:1]; end 42.0 1.56 3.5 16.0 31.5 begin goto abcd; abcd : end 129.0 2.08 9.4 62.0 98.3 begin switch s:=q; goto s[1]; q : end 210.0 24.60 73.0 692.0 598.0 x:=sin(y) 222.0 25.00 73.0 462.0 758.0 x:=cos(y) 84.0 *0.58 17.3 22.0 14.0 x:=abs(y) 270.0 *10.20 71.0 562.0 740.0 x:=exp(y) 261.0 *7.30 24.7 462.0 808.0 x:=ln(y) 246.0 *6.77 73.0 432.0 605.0 x:=sqrt(y) 272.0 *12.90 91.0 622.0 841.0 x:=arctan(y) 99.0 *1.38 18.7 72.0 37.5 x:=sign(y) 99.0 *2.70 24.7 152.0 41.1 x:=entier(y) 54.0 2.18 43.0 72.0 31.0 p0 69.0 *6.61 57.0 92.0 39.0 p1(x) 75.0 *8.28 65.0 132.0 45.0 p2(x, y) 93.0 *9.75 71.0 162.0 53.0 p2(x, y, z) 57.0 *0.92 8.6 17.0 38.5 loop time |
The performance studies found wide disparities between expected and observed timings. Chapter 9 does a deep dive on six Algol compilers.
A lot of work and idealism went into gather the data for this book (36 systems!). Unfortunately, the computer performance model was already noticeably inaccurate, and advances in compiler optimization and cpu design meant that the accuracy was only going to get worse. Anyways, there is lots of interesting performance data on 1960 era computers.
Whetstone lived on into the 1990s, when the SPEC benchmark started to its rise to benchmark dominance.
Likelihood of encountering a given sequence of statements
How many lines of code have to be read to be likely to encounter every meaningful sequence of  statements (a non-meaningful sequence would be the three statements
 break;break;break;)?
First, it is necessary to work out the likelihood of encountering a given sequence of statements within  lines of code.
If we just consider statements, then the following shows the percentage occurrence of the four kinds of C language statements (detailed usage information):
Statement % occurrence expression-stmt 60.3 selection-stmt 21.3 jump-stmt 15.0 iteration-stmt 3.4 |
The following analysis assumes that one statement occupies one line (I cannot locate data on percentage of statements spread over multiple lines).
An upper estimate can be obtained by treating this as an instance of the Coupon collector’s problem (which assumes that all items are equally likely), i.e., treating each sequence of statements as a coupon.
The average number of items that need to be processed before encountering all  distinct items is:
 =n*H_n") , where
, where  is the n-th harmonic number. When we are interested in at least one instance of every kind of C statement (i.e., the four listed above), we have:
 =8.33 right 9") .
.
There are  distinct sequences of three statements, but only
  meaningful sequences (when statements are not labelled, a
 jump-stmt can only appear at the end of a sequence). If we treat each of these 36 sequences as distinct, then =150.3 right 151") , 3-line sequences, or 453 LOC.
, 3-line sequences, or 453 LOC.
This approach both under- and over-estimates.
One or more statements may be part of different distinct sequences (causing the coupon approach to overestimate LOC). For instance, the following sequence of four statements:
expression-stmt selection-stmt expression-stmt expression-stmt |
contains two distinct sequences of three statements, i.e., the following two sequences:
expression-stmt selection-stmt selection-stmt expression-stmt expression-stmt expression-stmt |
There is a factor of 20-to-1 in percentage occurrence between the most/least common kind of statement. Does subdividing each kind of statement reduce this difference?
If expression-stmt, selection-stmt, and iteration-stmt are subdivided into their commonly occurring forms, we get the following percentages (where -other is the subdivision holding all cases whose occurrence is less than 1%, and the text to the right of sls- indicates the condition in an if-statement; data):
Statement % occurrence exs-func-call 22.3 exs-object=object 9.6 exs-object=func-call 6.0 exs-object=constant 4.2 exs-object_v++ 2.4 exs-other 15.7 sls-object 3.3 sls-object==object 1.9 sls-!object 1.6 sls-func-call 1.6 sls-expression 1.2 sls-other 11.7 jump-stmt 15.0 its-for 2.1 its-while 1.1 |
Function calls could be further broken down by number of arguments, but this would not have much impact because zero and one arguments are very common.
A more accurate model of the problem is needed.
A Markov chain approach handles both overlapping sequences, and statements having difference occurrence probabilities. For a sequence of length , the calculation involves an ") by matrix. For a sequence of three of the same kind of statement (chosen because ‘same kind’ of sequences are least likely to match, for a given length), the transition matrix is:
by matrix. For a sequence of three of the same kind of statement (chosen because ‘same kind’ of sequences are least likely to match, for a given length), the transition matrix is:
")
where  is the probability that statement
  will occur. The last row is the absorbing state. For the general case, see: Pattern Markov chains: Optimal Markov chain embedding through deterministic finite automata.
To calculate the probability that a sequence of the same kind of statement, of length , occurs within a sequence of statements, this transition matrix is multiplied  times (i.e., raised to the power ). The following code is an implementation in R (python script handling the general case):
seq_prob = function(N, s_len, Sk)
{
Sp=rep(Sk, s_len)
P=matrix(0, nrow = s_len+1, ncol = s_len+1) # Transition matrix
P[ , 1]=1-c(Sp, 1) # Probability of not occurring: first column
op=cbind(1:s_len, (1:s_len)+1) # diagonal for occurrence probabilities
P[op]=Sp           # assign occurrence probabilities
P[s_len+1, s_len+1]=1 # absorbing state

R=P # result value
for (n in 2:N)
   R=R %*% P # matrix multiply

return(R)
}

# Calculate probability for N equiprobable occurrences
# Result in last column of first row
N = 100
seq_len=3
sk=0.01
likelihood=seq_prob(N, seq_len, sk)[1, seq_len+1] |
If the occurrence likelihood of  (i.e., 1%), then the likelihood of encountering a sequence of three such statements in a sequence of 3 lines is
  (i.e., 0.0001%), while for a sequence of 100 lines it is
  .
.
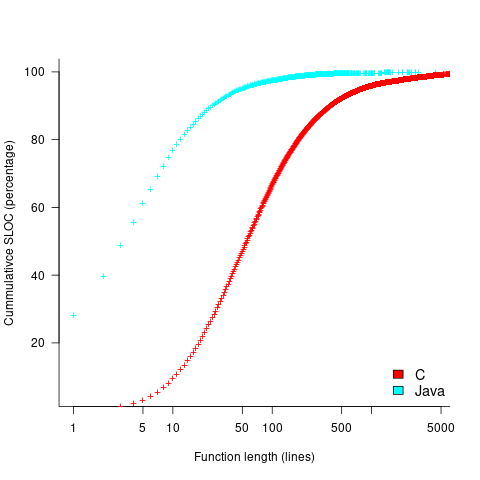
The number of statements contained in a function varies. To calculate the likelihood of encountering a particular sequence of three statements in a program, or collection of programs, we need to find the likelihood over all function lengths, adjusting for the probability of encountering functions containing a given number of statements.
The plot below shows the cumulative percentage of code as function LOC increases (data from Landman, Serebrenik, Bouwers and Vinju; plot code):
Calculating the likelihood of encountering a given sequence length in a function containing a given number of LOC (ignoring local definitions and blank lines), and then adjusting for the probability of a function containing a given number of LOC, the likelihood of encountering a sequence containing 3-to-10 of the same kind of statement (whose likelihood of occurrence is 1%) is given by the following table (calculation code):
of
seq length   Occurrence likelihood
    3               2.3e-05
    4               2.2e-07
    5               2.1e-09
    6               2.0e-11
    7               2.0e-13
    8               1.9e-15
    9               1.8e-17
10 1.8e-19 |
These values can be used to calculate the likelihood of encountering this ‘1%’ statement sequence in a repo containing C functions. For instance, in 1 million functions the likelihood of one instance of a three ‘1%’ same-kind statement sequence is: ^{10^6} approx 1") . For a repo containing one billion functions of C, there is an 88% chance of encountering a sequence of five such statements.
. For a repo containing one billion functions of C, there is an 88% chance of encountering a sequence of five such statements.
The sequence occurrence likelihood for Java will be smaller because Java functions contain fewer LOC.
At the subdivision level of kind-of-statement that has been found to occur in 1% of all statements, sequences up to five long are likely to be encountered at least once in a billion functions, with sequences containing more common statements occurring at a greater rate.
Sequences of kind-of-statements whose occurrence rate is well below 1% are unlikely to be encountered.
This analysis has assumed that the likelihood of occurrence of each statement in a sequence is independent of the other statements in the sequence. For some kind-of-statement this is probably not true, but no data is available.
The pervasive use of common statement sequences enables LLMs to do a good job of predicting what comes next.
Criteria for increased productivity investment
You have a resource of  person days to implement a project, and believe it is worth investing some of these days,
  , to improve team productivity (perhaps with training, or tooling). What is the optimal amount of resource to allocate to maximise the total project work performed (i.e., excluding the performance productivity work)?
Without any productivity improvement, the total amount of project work is:
") , where
, where ") is the starting team productivity function, f, i.e., with zero investment.
is the starting team productivity function, f, i.e., with zero investment.
After investing person days to increase team productivity, the total amount of project work is now:
*f(I)") , where
, where ") is the team productivity function, f, after the investment .
is the team productivity function, f, after the investment .
To find the value of that maximises  , we differentiate with respect to , and solve for the result being zero:
*f prime(I)-f(I) =0") , where
, where ") is the differential of the yet to be selected function
is the differential of the yet to be selected function  .
.
Rearranging this equation, we get:
}/{D*f prime(I)}")
We can plug in various productivity functions, , to find the optimal value of .
For a linear relationship, i.e., =p*I*f(0)") , where
, where  is the unit productivity improvement constant for a particular kind of training/tool, the above expression becomes:

Rearranging, we get:  , or
, or  .
.
The surprising (at least to me) result that the optimal investment is half the available days.
It is only worthwhile making this investment if it increases the total amount of project work. That is, we require:  < (D-I)*f(I)") .
.
For the linear improvement case, this requirement becomes:
*p*{D/2}") , or
, or 
This is the optimal case, but what if the only improvement options available are not able to sustain a linear improvement rate of at least  ? How many days should be invested in this situation?
A smaller investment,  , is only worthwhile when:
 < (D-s)*f(s)") , where
, where  , and
, and  .
.
Substituting gives:  < (D-k*D)*r*k*D*f(0)") , which simplifies to:
, which simplifies to:
} < r")
The blue/green line plot below shows the minimum value of  for
for  (and
(and  , increasing moves the line down), with the red line showing the optimal value
  . The optimal value of
  is at the point where has its minimum worthwhile value (the derivative of
 }") is
is ^2}") ; code):
; code):
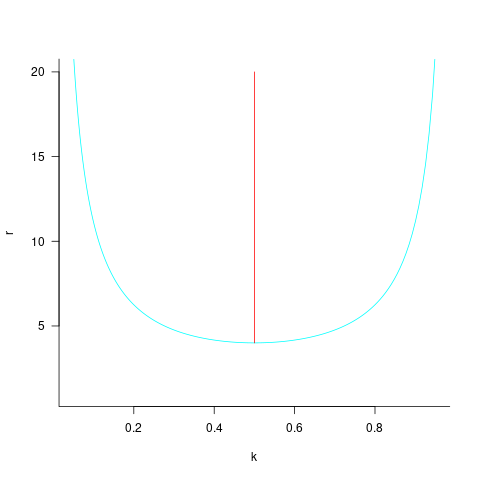
This shows that it is never worthwhile making an investment when:  , and that when it is always worthwhile investing , with any other value either wasting time or not extracting all the available benefits.
In practice, an investment may be subject to diminishing returns.
When the rate of improvement increases as the square-root of the number of days invested, i.e., =p*sqrt{I}*f(0)") , the optimal investment, and requirement on unit rate are as follows:
, the optimal investment, and requirement on unit rate are as follows:
only invest:  , when:
If the rate of improvement with investment has the form:  , the respective equations are:
only invest:  , when:
 ^{q+1}/{q^q D^q} < r") . The minimal worthwhile value of always occurs at the optimal investment amount.
. The minimal worthwhile value of always occurs at the optimal investment amount.
When the rate of improvement is logarithmic in the number of days invested, i.e., =p*log{I}*f(0)") , the optimal investment, and requirement on unit rate are as follows:
, the optimal investment, and requirement on unit rate are as follows:
only invest: -1}") , where
, where  is the Lambert W function, when:
 -1})(W(e*D)-1)} < r")
These expressions can be simplified using the approximation  approx log(x)-log(log(x))") , giving:
, giving:
only invest: }") , when:
, when: }/{(2+log(D))(log(D)-log(1+log(D)))} < r")
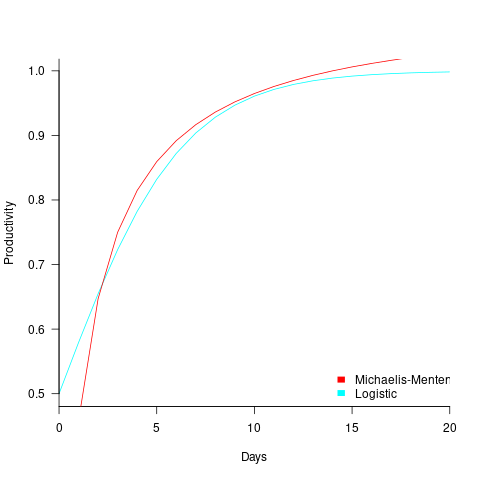
In practice, after improving rapidly, further investment on improving productivity often produces minor gains, i.e., the productivity rate plateaus. This pattern of rate change is often modelled using a logistic equation, e.g.,  .
.
However, following the process used above for this logistic equation produces an equation for , -1}/c") , that does not have any solutions when
, that does not have any solutions when  and are positive.
The problem is that the derivative goes to zero too quickly. The Michaelis-Menten equation,  , has an asymptotic limit whose derivative goes to zero sufficiently slowly that a solution is available.
only invest:  , when
The plot below shows example Michaelis-Menten and Logistic equations whose coefficients have been chosen to produce similar plots over the range displayed (code):
These equations are all well and good. The very tough problem of estimating the value of the coefficients is left to the reader.
This question has probably been answered before. But I have not seen it written down anywhere. References welcome.
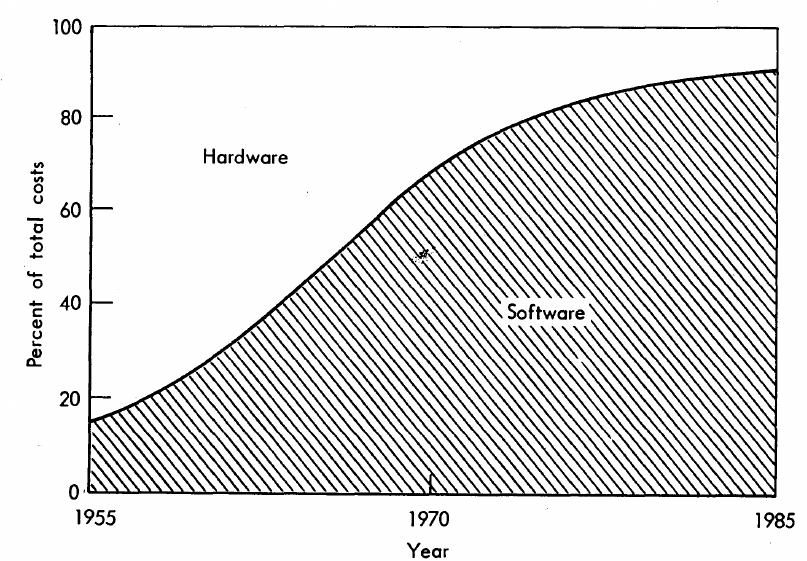
Hardware/Software cost ratio folklore
What percentage of data processing budgets is spent on software, compared to hardware?
The information in the plot below quickly became, and remains, the accepted wisdom, after it was published in May 1973 (page 49).
Is this another tale from software folklore? What does the evidence have to say?
What data did Barry Boehm use as the basis for this 1973 article?
Volume IV of the report Information processing/data automation implications of Air-Force command and control requirements in the 1980s (CCIP-85)(U), Technology trends: Software, contains this exact same plot, and Boehm is a co-author of volume XI of this CCIP-85 report (May 1972).
Neither the article or report explicitly calls out specific instances of hardware/software costs. However, Boehm’s RAND report Software and Its Impact A Quantitative Assessment (Dec 1972) gives three examples: the US Air Force estimated they will spend three times as much on software compared to hardware (in early 1970s), a military C&C system ($50-100 million hardware, $722 million software), and recent NASA expenditure ($100 million hardware, $200 million software; page 41).
The 10% hardware/90% software division by 1985 is a prediction made by Boehm (probably with others involved in the CCIP-85 work).
What is the source for the 1955 percentage breakdown? The 1968 article Software for Terminal-oriented systems (page 30) by Werner L. Frank may provide the answer (it also makes a prediction about future hardware/software cost ratios). The plot below shows both the Frank and Boehm data based on values extracted using WebPlotDigitizer (code+data):
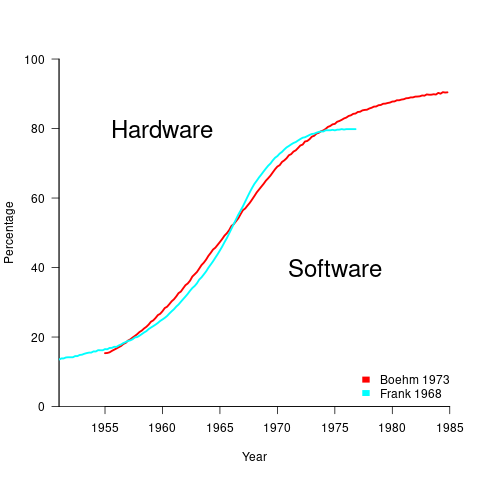
What about the shape of Boehm’s curve? A logistic equation is a possible choice, given just the start/end points, and fitting a regression model finds that  is an almost perfect fit (code+data).
How well does the 1972 prediction agree with 1985 reality?
At the start of the 1980s, two people wrote articles addressing this question: The myth of the hardware/software cost ratio by Harvey Cragon in 1982, and The history of Myth No.1 (page 252) by Werner L. Frank in 1983.
Cragon’s article cites several major ecosystems where recent hardware/software percentage ratios are comparable to Boehm’s ratios from the early 1970s, i.e., no change. Cragon suggests that Boehm’s data applies to a particular kind of project, where a non-recurring cost was invested to develop a new software system either for a single deployment or with more hardware to be purchased at a later date.
When the cost of software is spread over multiple installations, the percentage cost of software can dramatically shrink. It’s the one-of-a-kind developments where software can consume most of the budget.
Boehm’s published a response to Cragon’s article, which answered some misinterpretations of the points raised by Cragdon, and finished by claiming that the two of them agreed on the major points.
The development of software systems was still very new in the 1960s, and ambitious projects were started without knowing much about the realities of software development. It’s no surprise that software costs were so great a percentage of the total budget. Most of Boehm’s articles/reports are taken up with proposed cost reduction ideas, with the hardware/software ratio used to illustrate how ‘unbalanced’ the costs have become, an example of the still widely held belief that hardware costs should consume most of a budget.
Frank’s article references Cragon’s article, and then goes on to spend most of its words citing other articles that are quoting Boehm’s prediction as if it were reality; the second page is devoted 15 plots taken from these articles. Frank feels that he and Boehm share the responsibility for creating what he calls “Myth No. 1” (in a 1978 article, he lists The Ten Great Software Myths).
What happened at the start of 1980, when it was obvious that the software/hardware ratio predicted was not going to happen by 1985? Yes, obviously, move the date of the apocalypse forward; in this case to 1990.
Cragon’s article plots software/hardware budget data from an uncited Air Force report from 1980(?). I managed to find a 1984 report listing more data. Fitting a regression model finds that both hardware and software growth is deemed to be quadratic, with software predicted to consume 84% of DoD budget by 1990 (code+data).
Did software consume 84% of the DoD computer/hardware budget in 1990? Pointers to any subsequent predictions welcome.
LLMs and doing software engineering research
This week I attended the 65th COW workshop, the theme was Automated Program Repair and Genetic Improvement.
I first learned about using genetic programming to automatically fix reported faults at the 1st COW workshop in 2009. Claire Le Goues, a PhD student at that workshop, now a professor, returned to talk about the latest program repair work of her research group.
COW speakers are usually very upbeat, but uncertainty about the future was the general feeling I got from speakers at this workshop. The cause of this uncertainty was the topic of some talks and conversations: LLMs. Adding an LLM into the program repair process can produce a dramatic performance improvement.
Isn’t a dramatic performance improvement and a new technique great news for everyone? The performance improvement increases the likelihood of industrial adoption, and a new technique creates many opportunities for new research.
Despite claiming otherwise, most academics have zero interest in industrial adoption of their work, and some actively disdain practical uses of their work.
Major new techniques are great for PhD students; they provide an opportunity to kick-start a career by being in at the start of a new research area.
A major new technique can obsolete an established researcher’s expensively acquired area of expertise (expensive in personal time and effort). The expertise that enables a researcher to make state-of-the-art contributions to an active research area is a valuable asset; it can be used to attract funding, students and peer esteem. When a new technique dramatically improves the state-of-the-art, there is a sharp drop in the value of what is now yesterday’s know-how.
A major new technique removes some existing barriers to entering a field, and creates its own new ones. The result is that new people start working in a field, and some existing experts stop working in it.
At the workshop, I saw this process starting in automated program repair, and I imagine it’s also starting in many other research fields. It will probably take 3–5 years for the dust to start to settle; existing funded projects have to complete, and academia does not move that quickly.
A recent review of the use of LLMs in software engineering research found 229 papers; the table below shows the number of papers per year:
    Papers   Year
       7     2020
      11     2021
      51     2022
160 2023 to end July |
Assuming, say, 10K software engineering papers per year, then LLM related papers should be around 3% this year, likely in double figures next year, and possibly over 50% the year after.
Is research in software engineering en route to becoming another subfield of prompt engineering research?
Some data on the size of Cobol programs/paragraphs
Before the internet took off in the 1990s, COBOL was the most popular language, measured in lines of code in production use. People who program in Cobol often have a strong business focus, and don’t hang out on sites used aggregated by surveys of programming language use; use of the language is almost completely invisible to those outside the traditional data processing community. So who knows how popular Cobol is today.
Despite the enormous quantity of Cobol code that has been written, very little Cobol source is publicly available (Open source or otherwise; the NIST compiler validation suite is not representative). The reason for the sparsity of source code is that Cobol programs are used to process business data, and the code is useless without the appropriate data (even with the data, the output is only likely to be of interest to a handful of people).
Program and function/method size (in LOC) are basic units of source code measurement. Until open source happened, published papers containing these measurements were based on small sample sizes and the languages covered was somewhat spotty. Cobol oriented research usually has a business orientation, rather than being programming oriented, and now there is a plentiful supply of source code written in non-Cobol languages.
I recently discovered appendix B of 1st Lt Richard E. Boone’s Master’s thesis An investigation into the use of software product metrics for COBOL systems (it’s post Rome period). Several days/awk scripts and editor macros later, LOC data for 178 programs containing 2,682 paragraphs containing 53,255 statements is now online (code+data).
A note on terminology: Cobol functions/methods are called paragraphs.
A paragraph is created by attaching a label to the first statement of the paragraph (there are no variables local to a paragraph; all variables are global). The statement PERFORM NAME-OF-PARAGRAPH ‘calls’ the paragraph labelled by NAME-OF-PARAGRAPH, somewhat like gosub number in BASIC.
It is possible to specify a sequence of paragraphs to be executed, in a PERFORM statement. The statement PERFORM NAME-OF-P1 THRU NAME-OF-P99 causes all paragraphs appearing textually in the code between the start of paragraph NAME-1 and the end of paragraph NAME-99 to be executed.
As far as I can tell, Boone’s measurements are based on individual paragraphs, not any sequences of paragraphs that are PERFORMed (it is likely that some labelled paragraphs are never PERFORMed in isolation).
Appendix B lists for each program: the paragraphs it contains, and for each paragraph the number of statements, McCabe’s complexity, maximum nesting, and Henry and Kafura’s Information flow metric
There are, based on naming, many EXIT paragraphs (711 or 26%); these are single statement paragraphs containing the statement EXIT. When encountered as the last paragraph of a PERFORM THU statement, the EXIT effectively acts like a procedure return statement; in other contexts, the EXIT statement acts like a continue statement.
In the following code the developer could have written PERFORM PARA-1 THRU PARA-4, but if a related paragraph was added between PARA-4 and PARA-END_EXIT all PERFORMs explicitly referencing PARA-4 would need to be checked to see if they needed updating to the new last paragraph.
START. PERFORM PARA-1 THRU PARA-END-EXIT. PARA-1. DISPLAY 'PARA-1'. PARA-2. DISPLAY 'PARA-2'. PARA-3. DISPLAY 'PARA-3'. P3-EXIT. EXIT. PARA-4. DISPLAY 'PARA-4'. PARA-END-EXIT. EXIT. |
The plot below shows the number of paragraphs containing a given number of statements, the red dot shows the count with EXIT paragraphs are ignored (code+data):

How does this distribution compare with that seen in C and Java? The plot below shows the Cobol data (in black, with frequency scaled-up by 1,000) superimposed on the same counts for C and Java (C/Java code+data):
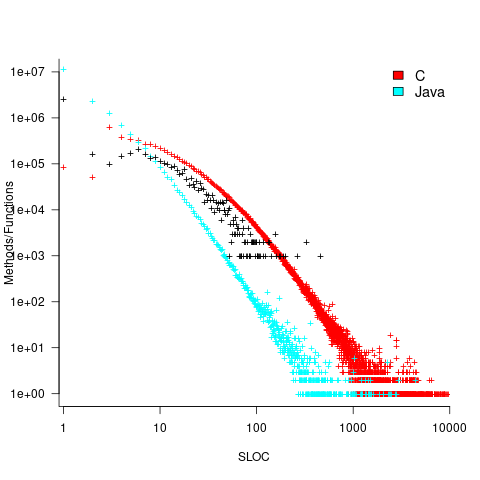
The distribution of statements per paragraph/function distribution for Cobol/C appears to be very similar, at least over the range 10-100. For less than 10-LOC the two languages have very different distributions. Is this behavior particular to the small number of Cobol programs measured? As always, more data is needed.
How many paragraphs does a Cobol program contain? The plot below shows programs ranked by the number of paragraphs they contain, including and excluding EXIT statements (code+data):
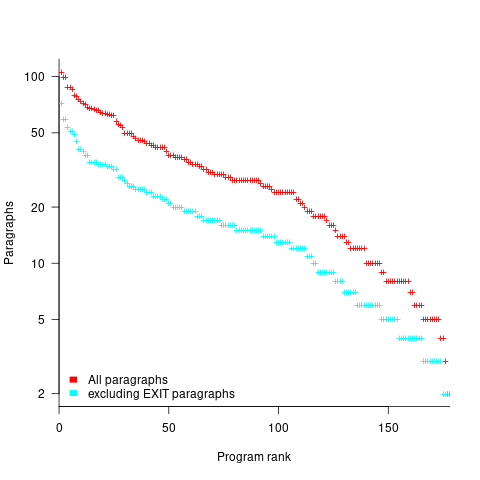
If you squint, it’s possible to imagine two distinct exponential declines, with the switch happening around the 100th program.
It’s tempting to draw some conclusions, but the sample size is too small.
Pointers to large quantities of Cobol source welcome.
Recent Comments