Archive
Why is actual implementation time often reported in whole hours?
Estimates of the time needed to implement a software task are often given in whole hours (i.e., no minutes), with round numbers being preferred. Surprisingly, reported actual implementation times also share this ‘preference’ for whole hours and round numbers (around a third of short task estimates are accurate, so it is to be expected that around a third of actual implementation times will be some number of whole hours, at least for the small percentage of projects that record task implementation time).
Even for accurate estimates, some variation in minutes around the hour boundary is to be expected for the actual implementation time. Why are developers reporting integer hour values for actual time?
The following are some of the possible reasons, two at opposite ends of the spectrum, for developers to log actual time as an integer number of hours:
- Parkinson’s law, i.e., the task was completed earlier and the minutes before the whole hour were filled with other activities,
- striving to complete a task by the end of the hour, much like a marathon runner strives to complete a race on a preselected time boundary,
- performing short housekeeping tasks once the primary task is complete, where management is aware of this overhead accounting.
Is it possible to distinguish between these developer behaviors by analysing many task durations?
My thinking is that all three of these practices occur, with some developers having a preference for following Parkinson’s law, and a few developers always striving to get things done.
Given that Parkinson’s law is 70 years old and well known, there ought to be a trail of research papers analysing a variety of models.
Parkinson specified two ‘laws’. The less well known second law, specifies that the number of bureaucrats in an organization tends to grow, regardless of the amount of work to be done. Governments and large organizations publish employee statistics, and these have been used to check Parkinson’s second law.
With regard to Parkinson’s first law, there are papers whose titles suggest that something more than arm waving is to be found within. Sadly, I have yet to find a non-arm waving paper. Given the extreme difficulty of obtaining data on task durations, this lack of papers is not surprising.
Perhaps our LLM overlords, having been trained on the contents of the Internet, will succeed where traditional search engines have failed. The usual suspects (Grok, ChatGPT, Perplexity and Deepseek) suggested various techniques for fitting models to data, rather than listing existing models.
A new company, Kimi, launched their highly-rated model yesterday, and to try it out I asked: “Discuss mathematical models that analyse the impact of project staff following Parkinson’s law”. The quality of the reply was impressive (my registration has not yet been accepted, so I cannot obtain a link to Kimi’s response). A link to Grok 3’s evaluation of Kimi’s five suggested modelling techniques.
Having spent a some time studying the issues of integer hour actual times, I have not found a way to distinguish between the three possibilities listed above, using estimate/actual time data. Software development involves too many possible changeable activities to be amenable to Taylor’s scientific management approach.
Good luck trying to constrain what developers can do and when they can do it, or requiring excessive logging of activities, just to make it possible to model the development process.
The Renzo Pomodoro dataset
Estimating how long it will take to complete a task is hard work, and the most common motivation for this work comes from external factors, e.g., the boss, or a potential client asks for an estimate to do a job.
People also make estimates for their own use, e.g., when planning work for the day. Various processes and techniques have been created to help structure the estimation process; for developers there is the Personal Software Process, and specifically for time estimation (but not developer specific), there is the Pomodoro Technique.
I met Renzo Borgatti at the first talk I gave on the SiP dataset (Renzo is the organizer of the Papers We Love meetup). After the talk, Renzo told me about his use of the Pomodoro Technique, and how he had 10-years worth of task estimates; wow, I was very interested. What happened next, and a work-in-progress analysis (plus data and R scripts) of the data can be found in the Renzo Pomodoro dataset repo.
The analysis progressed in fits and starts; like me Renzo is working on a book, and is very busy. The work-in-progress pdf is reasonably consistent.
I had never seen a dataset of estimates made for personal use, and had not read about the analysis of such data. When estimates are made for consumption by others, the motives involved in making the estimate can have a big impact on the values chosen, e.g., underestimating to win a bid, or overestimating to impress the boss by completing a task under budget. Is a personal estimate motive free? The following plot led me to ask Renzo if he was superstitious (in not liking odd numbers).
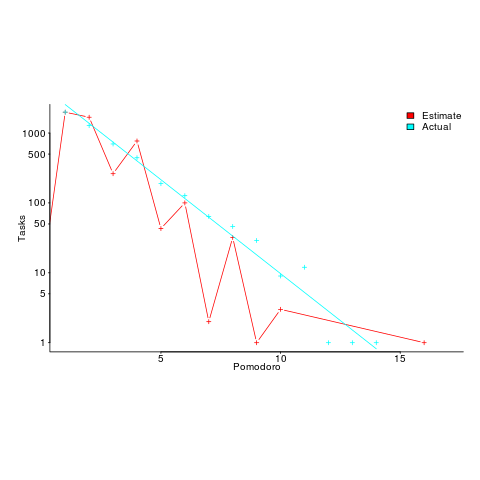
The plot shows the number of tasks for which there are a given number of estimates and actuals (measured in Pomodoros, i.e., units of 25 minutes). Most tasks are estimated to require one Pomodoro, and actually require this amount of effort.
Renzo educated me about the details of the Pomodoro technique, e.g., there is a 15-30 minute break after every four Pomodoros. Did this mean that estimates of three Pomodoros were less common because the need for a break was causing Renzo to subconsciously select an estimate of two or four Pomodoro? I am not brave enough to venture an opinion about what is going on in Renzo’s head.
Each estimated task has an associated tag name (sometimes two), which classifies the work involved, e.g., @planning. In the task information these tags have the form @word; I refer to them as at-words. The following plot is very interesting; it shows the date of use of each at-word, over time (ordered by first use of the at-word).
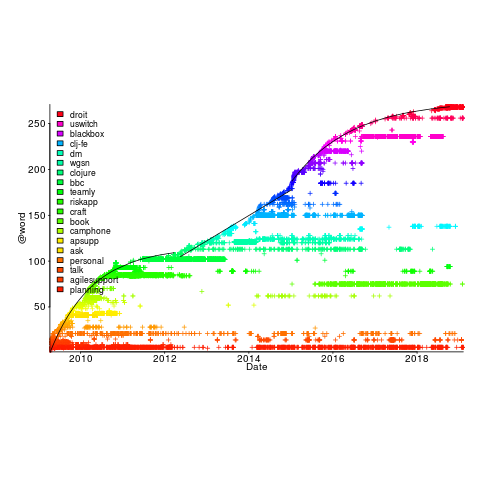
The first and third black lines are fitted regression models of the form  , where:
  is a constant and
  is the number of days since the start of the interval fitted. The second (middle) black line is a fitted straight line.
The slow down in the growth of new at-words suggests (at least to me) a period of time working in the same application domain (which involves a fixed number of distinct activities, that are ‘discovered’ by Renzo over time). More discussion with Renzo is needed to see if we can tie this down to what he was working on at the time.
I have looked for various other patterns and associations, involving at-words, but have not found any (but I did learn some new sequence analysis techniques, and associated R packages).
The data is now out there. What patterns and associations can you find?
Renzo tells me that there is a community of people using the Pomodoro technique. I’m hoping that others users of this technique, involved in software development, have recorded their tasks over a long period (I don’t think I could keep it up for longer than a week).
Perhaps there are PSP followers out there with data…
I offer to do a free analysis of software engineering data, provided I can make data public (in anonymized form). Do get in touch.
Recent Comments