Archive
Actual implementation times are often round numbers
To what extent do developers consciously influence the time taken to actually complete a task?
If the time estimated to complete a task is rather generous, a developer has the opportunity to follow Parkinson’s law (i.e., “work expands so as to fill the time available for its completion”), or if the time is slightly less than appears to be required, they might work harder to finish within the estimated time (like some marathon runners have a target time)?
The use of round numbers are a prominent pattern seen in task estimation times.
If round numbers appeared more often in the actual task completion time than would be expected by chance, it would suggest that developers are sometimes working to a target time. The following plot shows the number of tasks taking a given amount of actual time to complete, for project 615 in the CESAW dataset (similar patterns are present in the actual times of other projects; code+data):
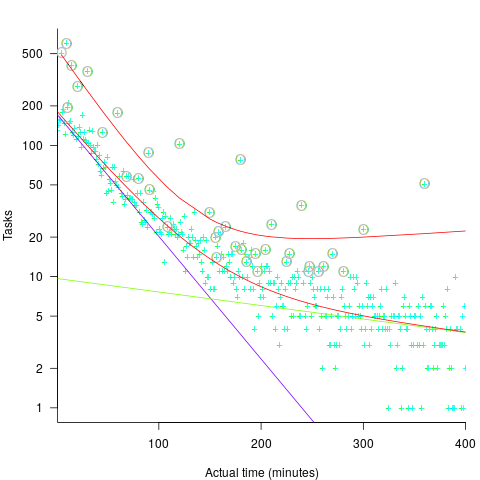
The red lines are a fitted bi-exponential distribution to the ‘spike’ (i.e., round numbers, circled in grey) and non-spike points (spikes automatically selected, see code for details), green and purple lines are the two components of the non-spike fit.
Tasks are not always started and completed in one continuous work session, work may be spread over multiple work sessions; the CESAW data includes the start/end time of every work session associated with each task (85% of tasks involve more than one work session, for project 615). The following plots are based on work sessions, rather than tasks, for tasks worked on over two (left) and three (right) sessions; colored lines denote session ordering within a task (code+data):
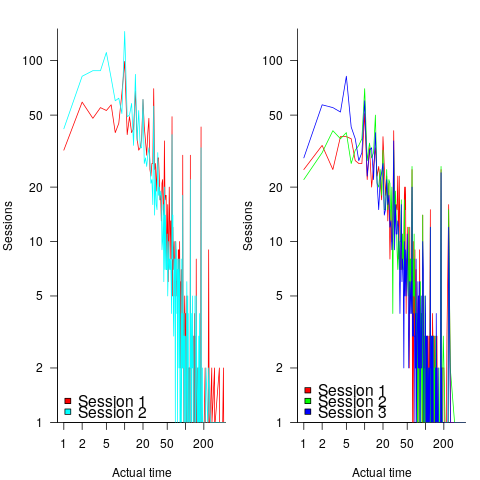
Shorter sessions dominate for the last session of task implementation, and spikes in the counts indicate the use of round numbers in all session positions (e.g., 180 minutes, which may be half a day).
Perhaps round number work session times are a consequence of developers using round number wall-clock times to start and end work sessions. The plot below shows (left) the number of work sessions starting at a given number of minutes past the hour, and (right) the number of work sessions ending at a given number of minutes past the hour; both for project 615 (code+data):

The arrow (green) shows the direction of the mean, and the almost invisible interior line shows that the length of the mean is almost zero. The five-minute points have slightly more session starts/ends than the surrounding minute values, but are more like bumps than spikes. The start of the hour, and 30-minutes, have prominent spikes, which might be caused by the start/end of the working day, and start/end of the lunch break.
Five-minutes is a convenient small rounding interval to either expand implementation time, or to target as a completion time. The following plot shows, for each of the 47 individuals working on project 615, the number of actual session times and the number exactly divisible by five. The green line shows the case where every actual is divisible by five, the purple line where 20% are divisible by five (expected for unbiased timing), the dashed purple lines show one standard deviation, the blue/green line is a fitted regression model ( ) (code+data):
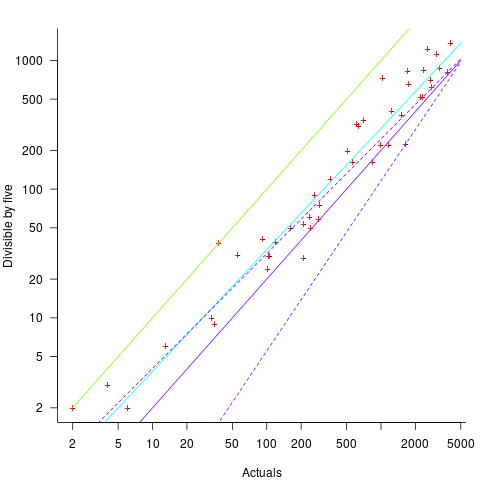
It appears that on average, five-minute session times occur twice as often as expected by chance; two individuals round all their actual session times (ok, it’s not that unlikely for the person with just two sessions).
Does it matter that some developers have a preference for using round numbers when recording time worked?
The use of round numbers in the recording of actual work sessions will inflate the total actual time for most tasks (because most tasks involve more than one session, and assuming that most rounding is not caused by developers striving to meet a target). The amount of error introduced is probably a lot less than the time variability caused by other implementation factors (I have yet to do the calculation).
I see the use of round numbers as a means of unpicking developer work habits.
Given the difficulty of getting developers to record anything, requiring them to record to minute-level accuracy appears at best optimistic. Would you work for a manager that required this level of effort detail (I know there is existing practice in other kinds of jobs)?
What can be learned from studying long gone development practices?
Current ideas about the best way of building a software system are heavily influenced by the ideas that captured the attention of previous generations of developers. Can anything of practical use be learned from studying long gone techniques for building software systems?
During the writing of my software engineering book, I was spending a lot of time researching the development techniques used during the twentieth century, and one day I suddenly realised that this was a waste of time. While early software developers tend to be eulogized today, the reality is that they were mostly people who had little idea what they were doing, who through personal competence of being in the right place at the right time managed to produce something good enough. On the whole, twentieth century software development techniques are only of historical interest. Yes, some timeless development principles were discovered, and these can be integrated into today’s techniques (which may also turn out to be of their-time).
My experience of software development in the late 1970s and 1980s is that there was rarely any connection between what management told the world about the development process, and how those reporting to the manager actually did the development.
If you are a manager in a world where software development is still very new, and you are given the job of managing the development of a software system, how do you go about it? A common approach is to apply the techniques that are already being used to run the manager’s organization. On a regular basis, managers came up with the idea of applying techniques from the science of industrial production (which is still happening today).
In the 1970s and 1980s there were usually very visible job hierarchies, and sharply defined roles. Organizations tended to use their existing job hierarchies and roles to create the structure for their software development employees. For years after I started work as a graduate, managers and secretaries were surprised to see me typing; secretaries typed, men did not type, and women developers fumed when they were treated like secretaries (because they had been seen typing).
The manual workers performed data entry, operated the computer (e.g., mounted tapes, and looked after the printer). The junior staff often started with the job title programmer, or perhaps junior programmer and there might be senior programmers; on paper these people wrote the code to implement the functionality specified by a systems analyst (or just analyst, or business analyst, perhaps with added junior or senior). Analysts did not to write code and programmers only coded what the specification they were given, at least according to management.
Pay level was set by the position in the job hierarchy, with those higher up earning more than those below them, and job titles/roles were also mapped to positions in the hierarchy. This created, in theory, a direct correspondence between pay and job title/role. In practice, organizations wanted to keep their productive employees, and so were flexible about the correspondence between pay and title, e.g., during their annual review some people were more interested in the status provided by a job title, while others wanted more money and did not care about job titles. Add into this mix the fact that pay/title levels rarely matched up between organizations, it soon became obvious to all that software job titles were a charade.
How should the people at the sharp end go about building a software system?
Structured programming was the widely cited technique in the 1970s. Consultants promoted their own variants, with Jackson structured programming being widely known in the UK, with regular courses and consultants offering to train staff. Today, structured programming appears remarkably simplistic, great for writing tiny programs (it has an academic pedigree), but not for anything larger than a thousand lines. Part of its appeal may have been this simplicity, many programs were small (because computer memory was measured in kilobytes) and management often thought that problems were simple (a recurring problem). There were a few adaptations that tried to address larger scale issues, e.g., Warnier/Orr structured programming.
The military were major employers of software developers in the 1960s and 1970s. In the US Work Breakdown Structure was mandated by the DOD for project development (for all projects, not just software), and in the UK we had MASCOT. These mandated development methodologies were created by committees, and have not been experimentally tested to be better/worse than any other approach.
I think the best management technique for successfully developing a software system in the 1970s and 1980s (and perhaps in the following decades), is based on being lucky enough to have a few very capable people, and then providing them with what is needed to get the job done while maintaining the fiction to upper management that the agreed bureaucratic plan is being followed.
There is one technique for producing a software system that rarely gets mentioned: keep paying for development until something good enough is delivered. Given the life-or-death need an organization might have for some software systems, paying what it takes may well have been a prevalent methodology during the early days of major software development.
To answer the question posed at the start of this post. What might be learned from a study of early software development techniques is the need for management to have lots of luck and to be flexible; funding is easier to obtain when managing a life-or-death project.
2021 in the programming language standards’ world
Last Tuesday I was on a Webex call (the British Standards Institute’s use of Webex for conference calls predates COVID 19) for a meeting of IST/5, the committee responsible for programming language standards in the UK.
There have been two developments whose effect, I think, will be to hasten the decline of the relevance of ISO standards in the programming language world (to the point that they are ignored by compiler vendors).
- People have been talking about switching to online meetings for years, and every now and again someone has dialed-in to the conference call phone system provided by conference organizers. COVID has made online meetings the norm (language working groups have replaced face-to-face meetings with online meetings). People are looking forward to having face-to-face meetings again, but there is talk of online attendance playing a much larger role in the future.
The cost of attending a meeting in person is the perennial reason given for people not playing an active role in language standards (and I imagine other standards). Online attendance significantly reduces the cost, and an increase in the number of people ‘attending’ meetings is to be expected if committees agree to significant online attendance.
While many people think that making it possible for more people to be involved, by reducing the cost, is a good idea, I think it is a bad idea. The rationale for the creation of standards is economic; customer costs are reduced by reducing
diversityincompatibilities across the same kind of product., e.g., all standard conforming compilers are consistent in their handling of the same construct (undefined behavior may be consistently different). When attending meetings is costly, those with a significant economic interest tend to form the bulk of those attending meetings. Every now and again somebody turns up for a drive-by-shooting, i.e., they turn up for a day to present a paper on their pet issue and are never seen again.Lowering the barrier to entry (i.e., cost) is going to increase the number of drive-by shootings. The cost of this spray of pet-issue papers falls on the regular attendees, who will have to spend time dealing with enthusiastic, single issue, newbies,
- The International Organization for Standardization (ISO is the abbreviation of the French title) has embraced the use of inclusive terminology. The ISO directives specifying the Principles and rules for the structure and drafting of ISO and IEC documents, have been updated by the addition of a new clause: 8.6 Inclusive terminology, which says:
“Whenever possible, inclusive terminology shall be used to describe technical capabilities and relationships. Insensitive, archaic and non-inclusive terms shall be avoided. For the purposes of this principle, “inclusive terminology” means terminology perceived or likely to be perceived as welcoming by everyone, regardless of their sex, gender, race, colour, religion, etc.
New documents shall be developed using inclusive terminology. As feasible, existing and legacy documents shall be updated to identify and replace non-inclusive terms with alternatives that are more descriptive and tailored to the technical capability or relationship.”
The US Standards body, has released the document INCITS inclusive terminology guidelines. Section 5 covers identifying negative terms, and Section 6 deals with “Migration from terms with negative connotations”. Annex A provides examples of terms with negative connotations, preceded by text in bright red “CONTENT WARNING: The following list contains material that may be harmful or
traumatizing to some audiences.”“Error” sounds like a very negative word to me, but it’s not in the annex. One of the words listed in the annex is “dummy”. One member pointed out that ‘dummy’ appears 794 times in the current Fortran standard, (586 times in ‘dummy argument’).
Replacing words with negative connotations leads to frustration and distorted perceptions of what is being communicated.
I think there will be zero real world impact from the use of inclusive terminology in ISO standards, for the simple reason that terminology in ISO standards usually has zero real world impact (based on my experience of the use of terminology in ISO language standards). But the use of inclusive terminology does provide a new opportunity for virtue signalling by members of standards’ committees.
While use of inclusive terminology in ISO standards is unlikely to have any real world impact, the need to deal with suggested changes of terminology, and new terminology, will consume committee time. Most committee members tend to a rather pragmatic, but it only takes one or two people to keep a discussion going and going.
Over time, compiler vendors are going to become disenchanted with the increased workload, and the endless discussions relating to pet-issues and inclusive terminology. Given that there are so few industrial strength compilers for any language, the world no longer needs formally agreed language standards; the behavior that implementations have to support is controlled by the huge volume of existing code. Eventually, compiler vendors will sever the cord to the ISO standards process, and outside the SC22 bubble nobody will notice.
Estimating using a granular sequence of values
When asked for an estimate of the time needed to complete a task, should developers be free to choose any numeric value, or should they be restricted to selecting from a predefined set of values (e.g, the Fibonacci numbers, or T-shirt sizes)?
Allowing any value to be chosen would appear to provide the greatest flexibility to make an accurate estimate. However, estimating is an intrinsically uncertain process (i.e., the future is unknown), and it is done by people with varying degrees of experience (which might be used to help guide their prediction about the future).
Restricting the selection process to one of the values in a granular sequence of numbers has several benefits, including:
- being able to adjust the gaps between permitted values to match the likely level of uncertainty in the task effort, or the best accuracy resolution believed possible,
- reducing the psychological stress of making an estimate, by explicitly giving permission to ignore the smaller issues (because they are believed to require a total effort that is less than the sequence granularity),
- helping to maintain developer self-esteem, by providing a justification when an estimate turning out to be inaccurate, e.g., the granularity prevented a more accurate estimate being made.
Is there an optimal sequence of granular values to use when making task estimates for a project?
The answer to this question depends on what is attempting to be optimized.
Given how hard it is to get people to produce estimates, the first criterion for an optimal sequence has to be that people are willing to use it.
I have always been struck by the ritualistic way in which the Fibonacci sequence is described by those who use it to make estimates. Rituals are an effective technique used by groups to help maintain members’ adherence to group norms (one of which might be producing estimates).
A possible reason for the tendency to use round numbers might estimate-values is that this usage is common in other social interactions involving numeric values, e.g., when replying to a request for the time of day.
The use of round numbers, when developers have the option of selecting from a continuous range of values, is a developer imposed granular sequence. What form do these round number sequences take?
The plot below shows the values of each of the six most common round number estimates present in the BrightSquid, SiP, and CESAW (project 615) effort estimation data sets, plus the first six Fibonacci numbers (code+data):
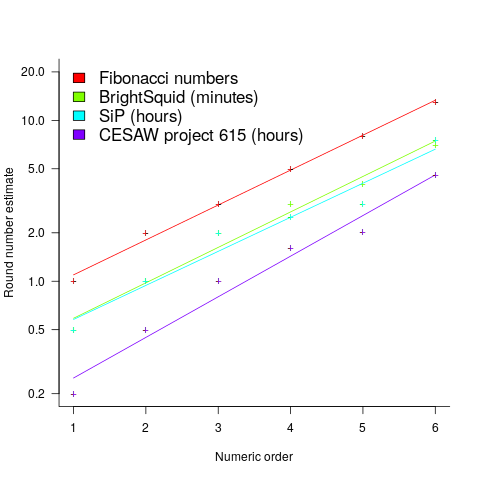
The lines are fitted regression models having the form:  (there is a small variation in the value of the constant; the smallest value for project 615 was probably calculated rather than being human selected).
This plot shows a consistent pattern of use across multiple projects (I know of several projects that use Fibonacci numbers, but don’t have any publicly available data). Nothing is said about this pattern being (near) optimal in any sense.
The time unit of estimation for this data was minutes or hours. Would the equation have the same form if the time unit was days, would the constant still be around  . I await the data needed to answer this question.
This brief analysis looked at granular sequences from the perspective of the distribution of estimates made. Perhaps it makes more sense to base a granular estimation sequence on the distribution of actual task effort. A topic for another post.
What is known about software effort estimation in 2021
What do we know about software effort estimation, based on evidence?
The few publicly available datasets (e.g., SiP, CESAW, and Renzo) involve (mostly) individuals estimating short duration tasks (i.e., rarely more than a few hours). There are other tiny datasets, which are mostly used to do fake research. The patterns found across these datasets include:
- developers often use round-numbers,
- the equation:
 , where
  is a constant that varies between projects, often explains around 50% of the variance present in the data. This equation shows that developers under-estimate short tasks and over-estimate long tasks. The exponent,
  , applies across most projects in the data,
 - individuals tend to either consistently over or under estimate,
- developer estimation accuracy does not change with practice. Possible reasons for this include: variability in the world prevents more accurate estimates, developers choose to spend their learning resources on other topics.
Does social loafing have an impact on actual effort? The data needed to answer this question is currently not available (the available data mostly involves people working on their own).
When working on a task, do developers follow Parkinson’s law or do they strive to meet targets?
The following plot suggests that one or the other, or both are true (data):
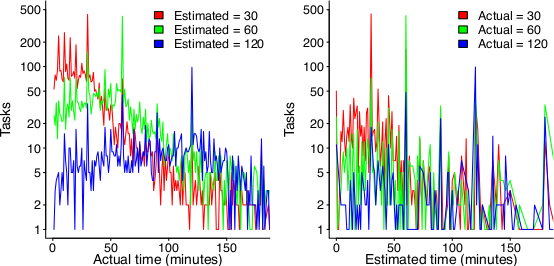
On the left: Each colored lines shows the number of tasks having a given actual implementation time, when they were estimated to take 30, 60 or 120 minutes (the right plot reverses the role of estimate/actual). Many of the spikes in the task counts are at round numbers, suggesting that the developer has fixated on a time to finish and is either taking it easy or striving to hit it. The problem is distinguishing them mathematically; suggestions welcome.
None of these patterns of behavior appear to be software specific. They all look like generic human behaviors. I have started emailing researchers working on project analytics in other domains, asking for data (no luck so far).
Other patterns may be present for many projects in the existing data, we have to wait for somebody to ask the right question (if one exists).
It is also possible that the existing data has some unusual characteristics that don’t apply to most projects. We won’t know until data on many more projects becomes available.
Production of software may continue to be craft based
Andrew Carnegie made his fortune in the steel industry, and his autobiography is a fascinating insight into the scientific vs. craft/folklore approach to smelting iron ore. Carnegie measured the processes involved in smelting; he tracked the input and outputs involved in the smelting process, and applied the newly available scientific knowledge (e.g., chemistry) to minimize the resources needed to extract iron from ore. Other companies continued to treat Iron smelting as a suck-it-and-see activity, driven by personal opinion and the application of techniques that had worked in the past.
The technique of using what-worked-last-time can be a successful strategy when the variability of the inputs is low. In the case of smelting Iron there was a lot of variability in the Iron ore, Limestone and Coke fed into the furnaces. The smelting companies in Carnegie’s day ‘solved’ this input variability problem by restricting their purchase of raw materials to mines that delivered material that worked last time.
Hiring an experienced chemist (the only smelting company to do so), Carnegie found out that the quality of ore (i.e., percentage Iron content) in some mines with a high reputation was much lower than the ore quality of some mines with a low reputation; Carnegie was able to obtain a low price for high quality ore because other companies did not appreciate its characteristics (and shunned using it). Other companies were unable to extract Iron from high quality ore because they stuck to using a process that worked for lower quality ore (the amount of Limestone and Coke added to the smelting process has to be adjusted based on the Iron content of the ore, otherwise the process may deliver poor results, or even fail to produce Iron; see chapter 13).
When Carnegie’s application of scientific knowledge, and his competitors’ opinion driven production, is combined with being a good businessman, it’s no surprise that Carnegie made a fortune from his Iron smelting business.
What are the parallels between iron smelting in Carnegie’s day and the software industry?
An obvious parallel is the industry dominance of opinion driven processes. But then, the lack of any scientific basis for the processes involved in building software systems would seem to make drawing parallels a pointless exercise.
Let’s assume that there was a scientific basis for some of the major processes involved in software engineering. Would any of these science-based processes be adopted?
The reason for using science based knowledge and mechanization is to reduce costs, which may lead to increased profits or just staying in business (in a Red Queen’s race).
Agriculture is an example of a business where science and mechanization dominate, and building construction is a domain where this has not happened. Perhaps building construction will become more mechanized when unknown missing components become available (mechanization was available for agricultural processes in the 1700s, but they did not spread for a century or two, e.g., threshing machines).
It’s possible to find parallels between software engineering and the smelting process, agriculture, and building construction. In fact, it parallels can probably be found between software engineering and any other major business domain.
Drawing parallels between software engineering and other major business domains creates a sense of familiarity. In practice, software is unlike most existing business domains in that software products are one-off creations of an intangible good, which has (virtually) zero cost of reproduction, while the economics of creating tangible goods (e.g., by smelting, sowing and reaping, or building houses) is all about reducing the far from zero cost of reproduction.
Perhaps the main take-away from the history of the production of tangible goods is that the scientific method has not always supplanted the craft approach to production.
Increase in defect fixing costs with distance from original mistake
During software development, when a mistake has been made it may be corrected soon after it is made, much later during development, by the customer in a shipped product, or never corrected.
If a mistake is corrected, the cost of correction increases as the ‘distance’ between its creation and detection increases. In a phased development model, the distance might be the number of phases between creation and detection; in a throw it at the wall and see if it sticks development model, the distance might be the number of dependencies on the ‘mistake’ code.
There are people who claim that detecting mistakes earlier will save money. This claim overlooks the cost of detecting mistakes, and in some cases earlier detection is likely to be more expensive (or the distribution of people across phases may rate limit what can be done in any phase). For instance, people might not be willing to read requirements documents, but be willing to try running software; some coding mistakes are only going to be encountered later during integration test, etc.
Folklore claims of orders of magnitude increases in fixing cost, as ‘distance’ increases, have been shown to be hand waving.
I know of two datasets on ‘distance’ between mistake creation and detection. A tiny dataset in Implementation of Fault Slip Through in Design Phase of the Project (containing only counts information; also see figure 6.41), and the CESAW dataset.
The plot below shows the time taken to fix 7,000 reported defects by distance between phases, for CESAW project 615 (code+data). The red lines are fitted regression models of the form  , for minimum fix times of 1, 5 and 10 minutes:
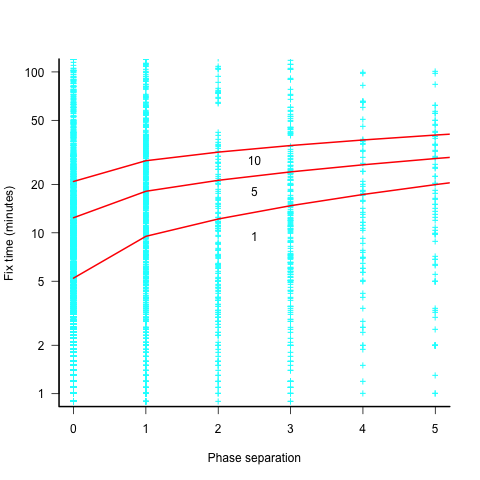
The above plot makes various simplifying assumptions, including: ‘sub-phases’ being associated with a ‘parent’ phase selected by your author, and the distance between all pairs of adjacent phase is the same (in terms of their impact on fix time).
A more sophisticated data model might change the functional form of the fitted regression model, but is unlikely to remove the general upward trend.
There are lots of fix times taking less than five minutes. Project 615 developed safety critical software, and so every detected mistake was recorded; on other projects, small mistakes would probably been fixed without an associated formal record.
I think that, if it were not for the, now discredited, folklore claiming outsized relative costs for fixing reported defects at greater ‘distances’ from the introduction of a mistake, this issue would be a niche topic.
Evidence-based book: six months of downloads
When my C book was first made available as a freely downloadable pdf, in 2005, there were between 19k to 37k downloads in the first week. The monthly download rate remained stable at around 1k per month for several years, and now floats around 100 per month.
I was hoping to have many more downloads for my Evidence-based software engineering book. The pdf became available last year on November 8th, and there were around 10k downloads in the first week. Then a link to my blog post announcing the availability of the book was posted to news.ycombinator. That generated quarter million downloads of the pdf, with an end-of-month figure of 275,309 plus 16,135 for the mobile friendly version.
The initial release did not include a mobile friendly version. After a half-a-dozen or so requests in various forums, I quickly worked up a mobile friendly pdf (i.e., the line length was reduced to be visually readable on a mobile phone, or at least on my 7-year-old phone which is smaller than most).
In May a link to the book’s webpage was posted on news.ycombinator. This generated 125k+ downloads, and the top-rated comment was that this was effectively a duplicate of the November post.
The plot below shows the number of pdf downloads for A4 and mobile formats, along with the number of kilo-bytes downloaded, for the 6-months since the initial release (code+data):
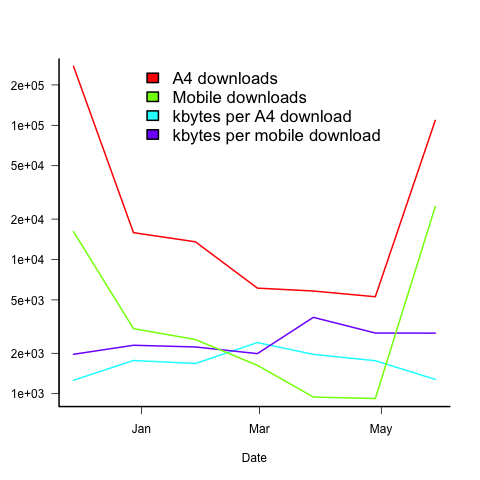
On average, there are five A4 downloads per mobile download (excluding November because of the later arrival of a mobile friendly version).
A download is rarely a complete copy (which is 23Mbyte), with the 6-month average being 1.7M for A4 and 2.5M for mobile. I have no idea of the reason for this difference.
The bytes per download is lower in the months when the ycombinator activity occurred. Is this because the ycombinator crowd tend to skim content (based on some of the comments, I suspect that many comments never read further than the cover)?
Copies of the pdf were made available on other sites, but based on the data I have seen, the downloads were not more than a few thousand.
I have not had any traffic spikes caused by non-English language interest. The C book experienced a ‘China’ spike, and I emailed the author of the blog post that caused it, to notify him of the Evidence-based book; he kindly posted an article on the book, but this did not generate a noticeable spike.
I’m confident that eventually a person in China/Russia/India/etc, with tens of thousands of followers, will post a link and there will be a noticeable download spike from that region.
What was the impact of content delivery networks and ISP caching? I have no idea. Pointers to write-ups on the topic welcome.
The CESAW dataset: a brief introduction
I have found that the secret for discovering data treasure troves is persistently following any leads that appear. For instance, if a researcher publishes a data driven paper, then check all their other papers. The paper: Composing Effective Software Security Assurance Workflows contains a lot of graphs and tables, but no links to data, however, one of the authors (William R. Nichols) published The Cost and Benefits of Static Analysis During Development which links to an amazing treasure trove of project data.
My first encounter with this data was this time last year, as I was focusing on completing my Evidence-based software engineering book. Apart from a few brief exchanges with Bill Nichols the technical lead member of the team who obtained and originally analysed the data, I did not have time for any detailed analysis. Bill was also busy, and we agreed to wait until the end of the year. Bill’s and my paper: The CESAW dataset: a conversation is now out, and focuses on an analysis of the 61,817 task and 203,621 time facts recorded for the 45 projects in the CESAW dataset.
Our paper is really an introduction to the CESAW dataset; I’m sure there is a lot more to be discovered. Some of the interesting characteristics of the CESAW dataset include:
- it is the largest publicly available project dataset currently available, with six times as many tasks as the next largest, the SiP dataset. The CESAW dataset involves the kind of data that is usually encountered, i.e., one off project data. The SiP dataset involves the long term evolution of one company’s 20 projects over 10-years,
- it includes a lot of information I have not seen elsewhere, such as: task interruption time and task stop/start {date/time}s (e.g., waiting on some dependency to become available)
- four of the largest projects involve safety critical software, for a total of 28,899 tasks (this probably more than two orders of magnitude more than what currently exists). Given all the claims made about the development about safety critical software being different from other kinds of development, here is a resource for checking some of the claims,
- the tasks to be done, to implement a project, are organized using a work-breakdown structure. WBS is not software specific, and the US Department of Defense require it to be used across all projects; see MIL-STD-881. I will probably annoy those in software management by suggesting the one line definition of WBS as: Agile+structure (WBS supports iteration). This was my first time analyzing WBS project data, and never having used it myself, I was not really sure how to approach the analysis. Hopefully somebody familiar with WBS will extract useful patterns from the data,
- while software inspections are frequently talked about, public data involving them is rarely available. The WBS process has inspections coming out of its ears, and for some projects inspections of one kind or another represent the majority of tasks,
- data on the kinds of tasks that are rarely seen in public data, e.g., testing, documentation, and design,
- the 1,324 defect-facts include information on: the phase where the mistake was made, the phase where it was discovered, and the time taken to fix.
As you can see, there is lots of interesting project data, and I look forward to reading about what people do with it.
Once you have downloaded the data, there are two other sources of information about its structure and contents: the code+data used to produce the plots in the paper (plus my fishing expedition code), and a CESAW channel on the Evidence-based software engineering Slack channel (no guarantees about response time).
Impact of native language on variable naming
When creating a variable name, to what extent are developers influenced by their native human language?
There is lots of evidence that variable names are either English words, abbreviations of English words, or some combination of these two. Source code containing a large percentage of identifiers using words from other languages does exist, but it requires effort to find; there is a widely expressed view that source should be English based (based on my experience of talking to non-native English speakers, and even the odd paper discussing the issue, e.g., Language matters).
Given that variable names can prove information that reduces the effort needed to understand code, and that most code is only ever read by the person who wrote it, developers should make the most of their expertise in using their native language.
To what extent do non-native English-speaking developers make use of their non-English native language?
I have found it very difficult to even have a discussion around this question. When I broach the subject with non-native English speakers, the response is often along the lines of “our develo0pers speak good English.” I am careful to set the scene by telling them of my interest in naming, and that I think there are benefits for developers to make use of their native language. The use of non-English languages in software development is not yet a subject that is open for discussion.
I knew that sooner or later somebody would run an experiment…
How Developers Choose Names is another interesting experiment involving Dror Feitelson (the paper rather confusingly refers to it as a survey, a post on an earlier experiment).
What makes this experiment interesting is that bilingual subjects (English and Hebrew) were used, and the questions were in English or Hebrew. The 230 subjects (some professional, some student) were given a short description and asked to provide an appropriate variable/function/data-structure name; English was used for 26 of the question, and Hebrew for the other 21 questions, and subjects answered a random subset.
What patterns of Hebrew usage are present in the variable names?
Out of 2017 answers, 14 contained Hebrew characters, i.e., not enough for statistical analysis. This does not mean that all the other variable names were only derived from English words, in some cases Hebrew words appeared via transcription using the 26 English letters. For instance, using “pinuk” for the Hebrew word that means “benefit” in English. Some variables were created from a mixture of Hebrew and English words, e.g., deservedPinuks and pinuksUsed.
Analysing this data requires someone who is fluent in Hebrew and English. I am not a fluent, or even non-fluent, Hebrew speaker. My role in this debate is encouraging others, and at last I have some interesting data to show people.
The paper spends time showing how for personal preferences result in a wide selection of names being chosen by different people for the same quantity. I cannot think of any software engineering papers that have addressed this issue for variable names, but there is lots of evidence from other fields; also see figure 7.33.
Those interested in searching source code for the impact of native-language might like to look at the names of variables appearing as operands of the bitwise and logical operators. Some English words occur much more frequently in the names of these variable, compared to variables that are operands of arithmetic operators, e.g., flag, status, and signal. I predict that non-native English-speaking developers will make use of corresponding non-English words.
Recent Comments