Archive
Impact of function size on number of reported faults
Are longer functions more likely to contain more coding mistakes than shorter functions?
Well, yes. Longer functions contain more code, and the more code developers write the more mistakes they are likely to make.
But wait, the evidence shows that most reported faults occur in short functions.
This is true, at least in Java. It is also true that most of a Java program’s code appears in short methods (in C 50% of the code is contained in functions containing 114 or fewer lines, while in Java 50% of code is contained in methods containing 4 or fewer lines). It is to be expected that most reported faults appear in short functions. The plot below shows, left: the percentage of code contained in functions/methods containing a given number of lines, and right: the cumulative percentage of lines contained in functions/methods containing less than a given number of lines (code+data):

Does percentage of program source really explain all those reported faults in short methods/functions? Or are shorter functions more likely to contain more coding mistakes per line of code, than longer functions?
Reported faults per line of code is often referred to as: defect density.
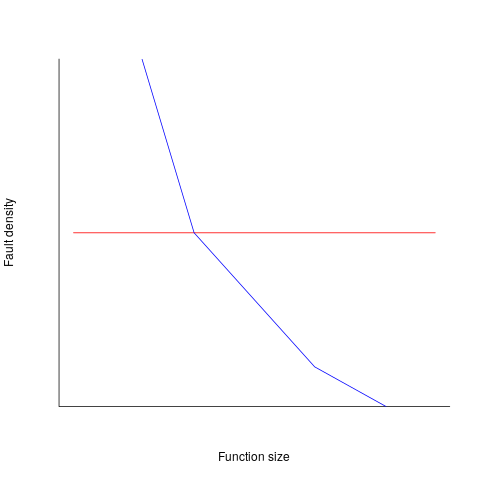
If defect density was independent of function length, the plot of reported faults against function length (in lines of code) would be horizontal; red line below. If every function contained the same number of reported faults, the plotted line would have the form of the blue line below.
Two things need to occur for a fault to be experienced. A mistake has to appear in the code, and the code has to be executed with the ‘right’ input values.
Code that is never executed will never result in any fault reports.
In a function containing 100 lines of executable source code, say, 30 lines are rarely executed, they will not contribute as much to the final total number of reported faults as the other 70 lines.
How does the average percentage of executed LOC, in a function, vary with its length? I have been rummaging around looking for data to help answer this question, but so far without any luck (the llvm code coverage report is over all tests, rather than per test case). Pointers to such data very welcome.
Statement execution is controlled by if-statements, and around 17% of C source statements are if-statements. For functions containing between 1 and 10 executable statements, the percentage that don’t contain an if-statement is expected to be, respectively: 83, 69, 57, 47, 39, 33, 27, 23, 19, 16. Statements contained in shorter functions are more likely to be executed, providing more opportunities for any mistakes they contain to be triggered, generating a fault experience.
Longer functions contain more dependencies between the statements within the body, than shorter functions (I don’t have any data showing how much more). Dependencies create opportunities for making mistakes (there is data showing dependencies between files and classes is a source of mistakes).
The previous analysis makes a large assumption, that the mistake generating a fault experience is contained in one function. This is true for 70% of reported faults (in AspectJ).
What is the distribution of reported faults against function/method size? I don’t have this data (pointers to such data very welcome).
The plot below shows number of reported faults in C++ classes (not methods) containing a given number of lines (from a paper by Koru, Eman and Mathew; code+data):

It’s tempting to think that those three curved lines are each classes containing the same number of methods.
What is the conclusion? There is one good reason why shorter functions should have more reported faults, and another good’ish reason why longer functions should have more reported faults. Perhaps length is not important. We need more data before an answer is possible.
How are C functions different from Java methods?
According to the right plot below, most of the code in a C program resides in functions containing between 5-25 lines, while most of the code in Java programs resides in methods containing one line (code+data; data kindly supplied by Davy Landman):
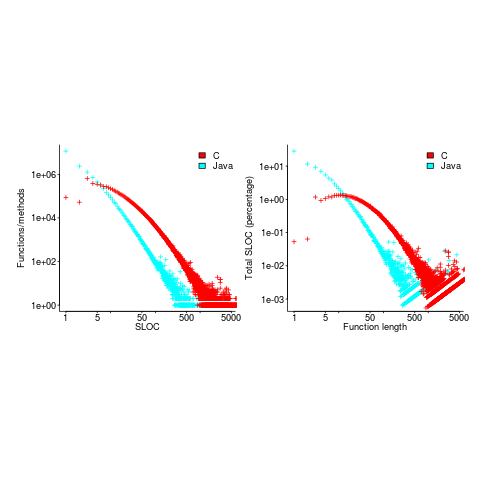
The left plot shows the number of functions/methods containing a given number of lines, the right plot shows the total number of lines (as a percentage of all lines measured) contained in functions/methods of a given length (6.3 million functions and 17.6 million methods).
Perhaps all those 1-line Java methods are really complicated. In C, most lines contain a few tokens, as seen below (code+data):

I don’t have any characters/tokens per line data for Java.
Is Java code mostly getters and setters?
I wonder what pattern C++ will follow, i.e., C-like, Java-like, or something else? If you have data for other languages, please send me a copy.
Plotting artifacts when the axis involves lines of code
While reading a report from the very late Rome period, the plot below caught my attention (the regression line was not in the original plot). The points follow a general trend, suggesting that when implementing a module, lines of code written per man-hour increases as the size of the module increases (in LOC). There are explanations for such behavior: perhaps module implementation time is mostly think-time that is independent of LOC, or perhaps larger modules contain more lines that can be quickly implemented (code+data).
Then I realised that the pattern of points was generated by a mathematical artifact. Can you spot the artifact?
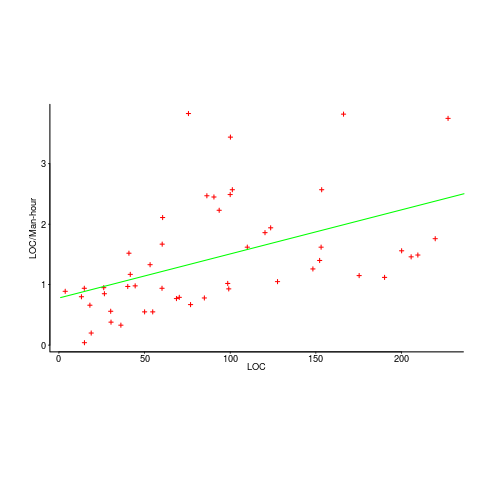
The x-axis shows LOC, and the y-axis shows LOC/man-hour. Just plotting LOC against LOC would produce a row of points along a straight line, and if we treat dividing by man-hours as roughly equivalent to dividing by a random number (which might have some correlation with LOC), the result is points scattered around a line going up to the right.
If LOC-per-hour were constant, the points would form a horizontal line across the plot.
In the below left plot, from a different report (whose axis are function-points, and function-points implemented per month), the author has fitted a line, and it is close to horizontal (suggesting that the mean FP-per-month is constant).
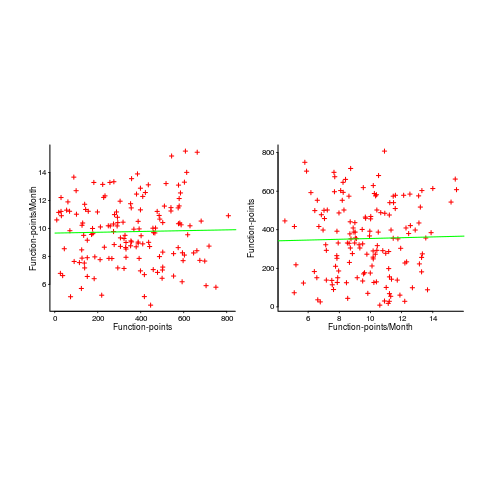
In fact the points are essentially random, and the line is a terrible fit (just how terrible is shown by switching the axis and refitting the line, above right; the refitted line should be vertical, but is horizontal. There is no connection between FP and FP-per-month, which is a good thing because the creators of function-points intended this to be true).
What process might generate this random scattering, rather than the trend seen in the first plot? If the implementation time was proportional to both the number of FP and some uniform random component, then the FP/time ratio would have the pattern seen.
The plots below show module size (in LOC) against man-hour (left) and FP against months (right):
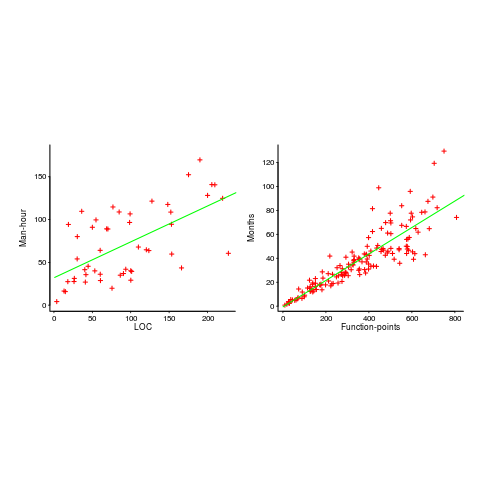
The module-LOC points are all over the place, while the FP points look as-if they are roughly consistent. Perhaps the module-LOC measurements came from a wide variety of sources, and we should not expect a visually pleasant trend.
Plotting LOC against LOC appears in other guises. Perhaps the most common being plotting fault-density against LOC; fault-density is generally calculated as faults/LOC.
Of course the artifacts also occur when plotting other kinds of measurements. Lines of code happens to be a commonly plotted quantity (at least in software engineering).
Growth of conditional complexity with file size
Conditional statements are a fundamental constituent of programs. Conditions are driven by the requirements of the problem being solved, e.g., if the water level is below the minimum, then add more water. As the problem being solved gets more complicated, dependencies between subproblems grow, requiring an increasing number of situations to be checked.
A condition contains one or more clauses, e.g., a single clause in: if (a==1), and two clauses in: if ((x==y) && (z==3)); a condition also appears as the termination test in a for-loop.
How many conditions containing one clause will a 10,000 line program contain? What will be the distribution of the number of clauses in conditions?
A while back I read a paper studying this problem (“What to expect of predicates: An empirical analysis of predicates in real world programs”; Google currently not finding a copy online, grrr, you will have to hassle the first author: durelli@icmc.usp.br, or perhaps it will get added to a list of favorite publications {be nice, they did publish some very interesting data}) it contained a table of numbers and yesterday my analysis of the data revealed a surprising pattern.
The data consists of SLOC, number of files and number of conditions containing a given number of clauses, for 63 Java programs. The following plot shows percentage of conditionals containing a given number of clauses (code+data):

The fitted equation, for the number of conditionals containing a given number of clauses, is:

where:  (the coefficient for the fitted regression model is 0.56, but square-root is easier to remember),
  , and
, and  is the number of clauses.
The fitted regression model is not as good when  or
or  is always used.
This equation is an emergent property of the code; simply merging files to increase the average length will not change the distribution of clauses in conditionals.
When  , all conditionals contain the same number of clauses, off to infinity. For the 63 Java programs, the mean
  was 2,625, maximum 11,710, and minimum 172.
I was expecting SLOC to have an impact, but was not expecting number of files to be involved.
What grows with SLOC? Number of global variables and number of dependencies. There are more things available to be checked in larger programs, and an increase in dependencies creates the need to perform more checks. Also, larger programs are likely to contain more special cases, which are likely to involve checking both general and specific values (i.e., more clauses in conditionals); ok, this second sentence is a bit more arm-wavy than the first. The prediction here is that the percentage of global variables appearing in conditions increases with SLOC.
Chopping stuff up into separate files has a moderating effect. Since I did not expect this, I don’t have much else to say.
This model explains 74% of the variance in the data (impressive, if I say so myself). What other factors might be involved? Depth of nesting would be my top candidate.
Removing non-if-statement related conditionals from the count would help clarify things (I don’t expect loop-controlling conditions to be related to amount of code).
Two interesting data-sets in one week, with 10-days still to go until Christmas 🙂
Update: Fitting the same equation to the data from a later paper by the same group, based on mobile applications written in Swift and Objective-C, also produces a well-fitted regression model (apart from the term specifying an interactions between  and
and  ).
).
Update: Thanks to Frank Busse for reminding me of the FAA report An Investigation of Three Forms of the Modified Condition Decision Coverage (MCDC) Criterion, which contains detailed information on the 20,256 conditionals in five Ada programs. The number of conditionals containing a given number of clauses is fitted by a power law (exponent is approximately -3).
How many ways of programming the same specification?
How many different ways are there of writing a program to implement a given specification? Non-trivial specifications probably have an enormous number of possible programming solutions. What about really simple specifications, say something based on the 3n+1 problem (write a programs that takes a list of integers and outputs their ‘3n+1’ length; ‘3n+1’ length algorithm: for integer  , if
, if  is even divide it by
  and assign the result to
  , otherwise
  is odd, multiply it by
  and add
  to give the new value of
  ; repeat the process, counting the number of iterations until
  reaches
  )?.
)?.
I can think of a dozen or so (slightly) different ways that I might write a program to solve this problem. If I really had to I could probably come up with a few hundred different solutions, but I think the source code of these programs would not look like something I would normally write. If I was to run a competition how many different answers might I get? If you twisted my arm I might have said 500. What do you think?
Meine van der Meulen studied the N-version programing for his PhD thesis (N groups independently write a program to the same specification, compare the output of the N programs and select the ‘best’ answer; cannot find a copy of the thesis online). This was empirical work and van der Meulen posted the above 3n+1 problem to a programming competition website and used the 95,497 submitted solutions for his analysis; he also kindly sent me a copy of the solutions (11,674 solutions were written in Pascal, the rest were in C).
Not all the solutions correctly solve the problem. I ignored this ‘detail’. There are also many duplicates (as in identical source code).
I am interested in differently coded solutions. I defined different as the sequence of operators/punctuators making up the program being different (or at least having a different MD5 checksum), so identifiers and comments are ignored. Should permutations in the order of independent adjacent statements really be counted as different? For the sack of keeping my life simple they current are. This definition of differently coded reduces the original 63,823 C programs down to 6,301. Wow, how are 6k+ different programs possible?
The original specification did not mention performance, but lots of developers did all sorts of weird and wonderful stuff to improve runtime performance. The most common optimization technique used (apart from some inventive ways of checking for odd/even) was to cache previous answers along with the solution for all the intermediate steps that were passed through on the way to 1 (the path from the starting value to 1 is very erratic and sometimes goes through values greater than the starting value) and check this cache to see whether it contains the current value of .
.
A common measure of program size is lines of code. What is the size distribution, in LOC, for these 6,301 programs? One program has been labeled an outlier and excluded from the analysis (most of its 8,345 lines were taken up with initializing a data structure with precomputed solutions).
The following plots lines of code against the number of programs containing that many lines (download code and data).
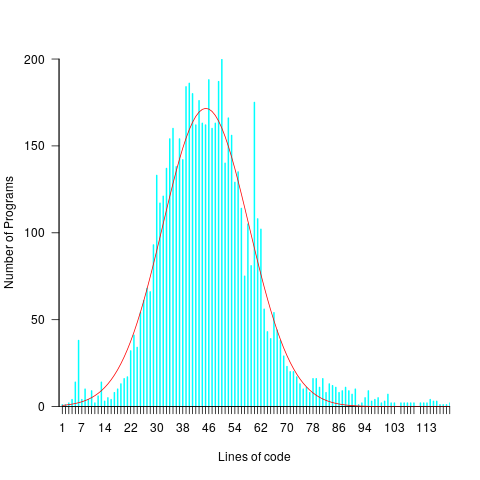
The mean program length is 46.3 lines, standard deviations 15.4. The red curve is a Normal distribution whose mean/sd has been tweaked to give a better visual fit (a Shapiro-Wilk test dispels any hope tht the distribution might be Normal). There is no reason to think that the data will be fitted by any known distribution and I’m not going to overfit on one data-point. If pushed I will wave my arms and describe the distribution as Normalish with added spikes and a fat right tail.
That spike around 60 lines is interesting. Is this group of solutions all doing the same thing but with different statement orderings? I have previously written about how gcc/llvm do a good job of turning the core of the algorithm into the same machine code. Perhaps a future version of these compilers will be able to tell us whether the programs clumping around 60 LOC are doing the same thing.
Recent Comments