Archive
Predicting the size of the Linux kernel binary
How big is the binary for the Linux kernel? Depending on the value of around 15,000 configuration options, the size of the version 5.8 binary could be anywhere between 7.3Mb and 2,134 Mb.
Who is interested in the size of the Linux kernel binary?
We are not in the early 1980s, when memory for a desktop microcomputer often topped out at 64K, and software was distributed on 360K floppies (720K when double density arrived; my companies first product was a code optimizer which reduced program size by around 10%).
While desktop systems usually have oodles of memory (disk and RAM), developers targeting embedded systems seek to reduce costs by minimizing storage requirements, security conscious organizations want to minimise the attack surface of the programs they run, and performance critical systems might want a kernel that fits within a processors’ L2/L3 cache.
When management want to maximise the functionality supported by a kernel within given hardware resource constraints, somebody gets the job of building kernels supporting various functionality to find out the size of the binaries.
At around 4+ minutes per kernel build, it’s going to take a lot of time (or cloud costs) to compare lots of options.
The paper Transfer Learning Across Variants and Versions: The Case of Linux Kernel Size by Martin, Acher, Pereira, Lesoil, Jézéquel, and Khelladi describes an attempt to build a predictive model for the size of the kernel binary. This paper includes an extensive list of references.
The author’s approach was to first obtain lots of kernel binary sizes by building lots of kernels using random permutations of on/off options (only on/off options were changed). Seven kernel versions between 4.13 and 5.8 were used, producing 243,323 size/option setting combinations (complete dataset). This data was used to train a machine learning model.
The accuracy of the predictions made by models trained on a single kernel version were accurate within that kernel version, but the accuracy of single version trained models dropped dramatically when used to predict the binary size of later kernel versions, e.g., a model trained on 4.13 had an accuracy of 5% MAPE predicting 4.13, when predicting 4.15 the accuracy is 20%, and 32% accurate predicting 5.7.
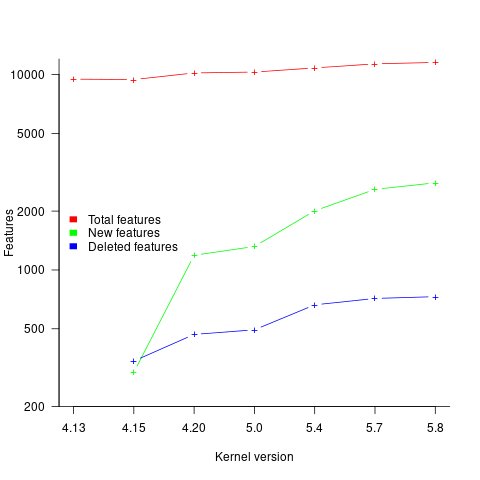
I think that the authors’ attempt to use this data to build a model that is accurate across versions is doomed to failure. The rate of change of kernel features (whose conditional compilation is supported by one or more build options) supported by Linux is too high to be accurately modelled based purely on information of past binary sizes/options. The plot below shows the total number of features, newly added, and deleted features in the modelled version of the kernel (code+data):
What is the range of impacts of each build option, on binary size?
If each build option is independent of the others (around 44% of conditional compilation directives in the kernel source contain one option), then the fitted coefficients of a simple regression model gives the build size increment when the corresponding option is enabled. After several cpu hours, the 92,562 builds involving 9,469 options in the version 4.13 build data were fitted. The plot below shows a sorted list of the size contribution of each option; the model  is 0.72, i.e., quite a good fit (code+data):

While the mean size increment for an enabled option is 75K, around 40% of enabled options decreases the size of the kernel binary. Modelling pairs of options (around 38% of conditional compilation directives in the kernel source contain two options) will have some impact on the pattern of behavior seen in the plot, but given the quality of the current model ( is 0.72) the change is unlikely to be dramatic. However, the simplistic approach of regression fitting the 90 million pairs of option interactions is not practical.
What might be a practical way of estimating binary size for any kernel version?
The size of a binary is essentially the quantity of code+static data it contains.
An estimate of the quantity of conditionally compiled source code dependent on a given option is likely to be a good proxy for that option’s incremental impact on binary size.
It’s trivial to scan source code for occurrences of options in conditional compilation directives, and with a bit more work, the number of lines controlled by the directive can be counted.
There has been a lot of evidence-based research on software product lines, and feature macros in particular. I was expecting to find a dataset listing the amount of code controlled by build options in Linux, but the data I can find does not measure Linux.
The Martin et al. build data is perfectfor creating a model linking quantity of conditionally compiled source code to change of binary size.
Perturbed expressions may ‘recover’
This week I have been investigating the impact of perturbing the evaluation of random floating-point expressions. In particular, the impact of adding 1 (and larger values) at a random point in an expression containing many binary operators (simply some combination of add/multiply).
What mechanisms make it possible for the evaluation of an expression to be unchanged by a perturbation of +1.0 (and much larger values)? There are two possible mechanisms:
- the evaluated value at the perturbation point is ‘watered down’ by subsequent operations, such that the original perturbed value makes no contribution to the final result. For instance, the IEEE single precision float mantissa is capable of representing 6-significant digits; starting with, say, the value
0.23, perturbing by adding1.0gives1.23, followed by a sequence of many multiplications by values between zero and one could produce, say, the value6.7e-8, which when added to, say,0.45, gives0.45, i.e., the perturbed value is too small to affect the result of the add, - the perturbed branch of the expression evaluation is eventually multiplied by zero (either because the evaluation of the other branch produces zero, or the operand happens to be zero). The exponent of an IEEE single precision float can represent values as small as
1e-38, before underflowing to zero (ignoring subnormals); something that is likely to require many more multiplies than required to lose 6-significant digits.
The impact of a perturbation disappears when its value is involved in a sufficiently long sequence of repeated multiplications.
The probability that the evaluation of a sequence of  multiplications of random values uniformly distributed between zero and one produces a result less than
  is given by
 }/{(N-1)!}") , where
, where  is the incomplete gamma function, and
  is the upper bounds (1 in our case). The plot below shows this cumulative distribution function for various (code):
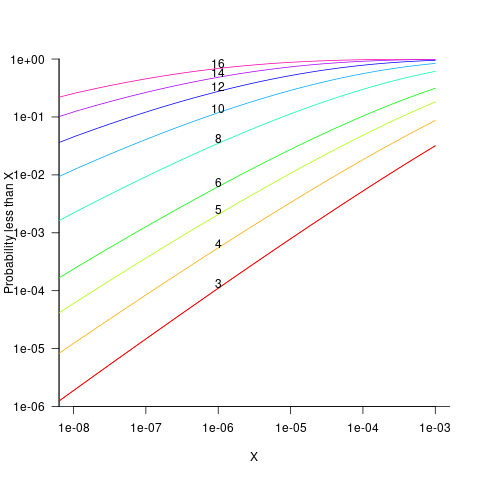
Looking at this plot, a sequence of 10 multiplications has around a 1-in-10 chance of evaluating to a value less than 1e-6.
In practice, the presence of add operations will increase the range of operands values to be greater than one. The expected distribution of result values for expressions containing various percentages of add/multiply operators is covered in an earlier post.
The probability that the evaluation of an expression involves a sequence of multiplications depends on the percentage of multiply operators it contains, and the shape of the expression tree. The average number of binary operator evaluations in a path from leaf to root node in a randomly generated tree of operands is proportional to  .
.
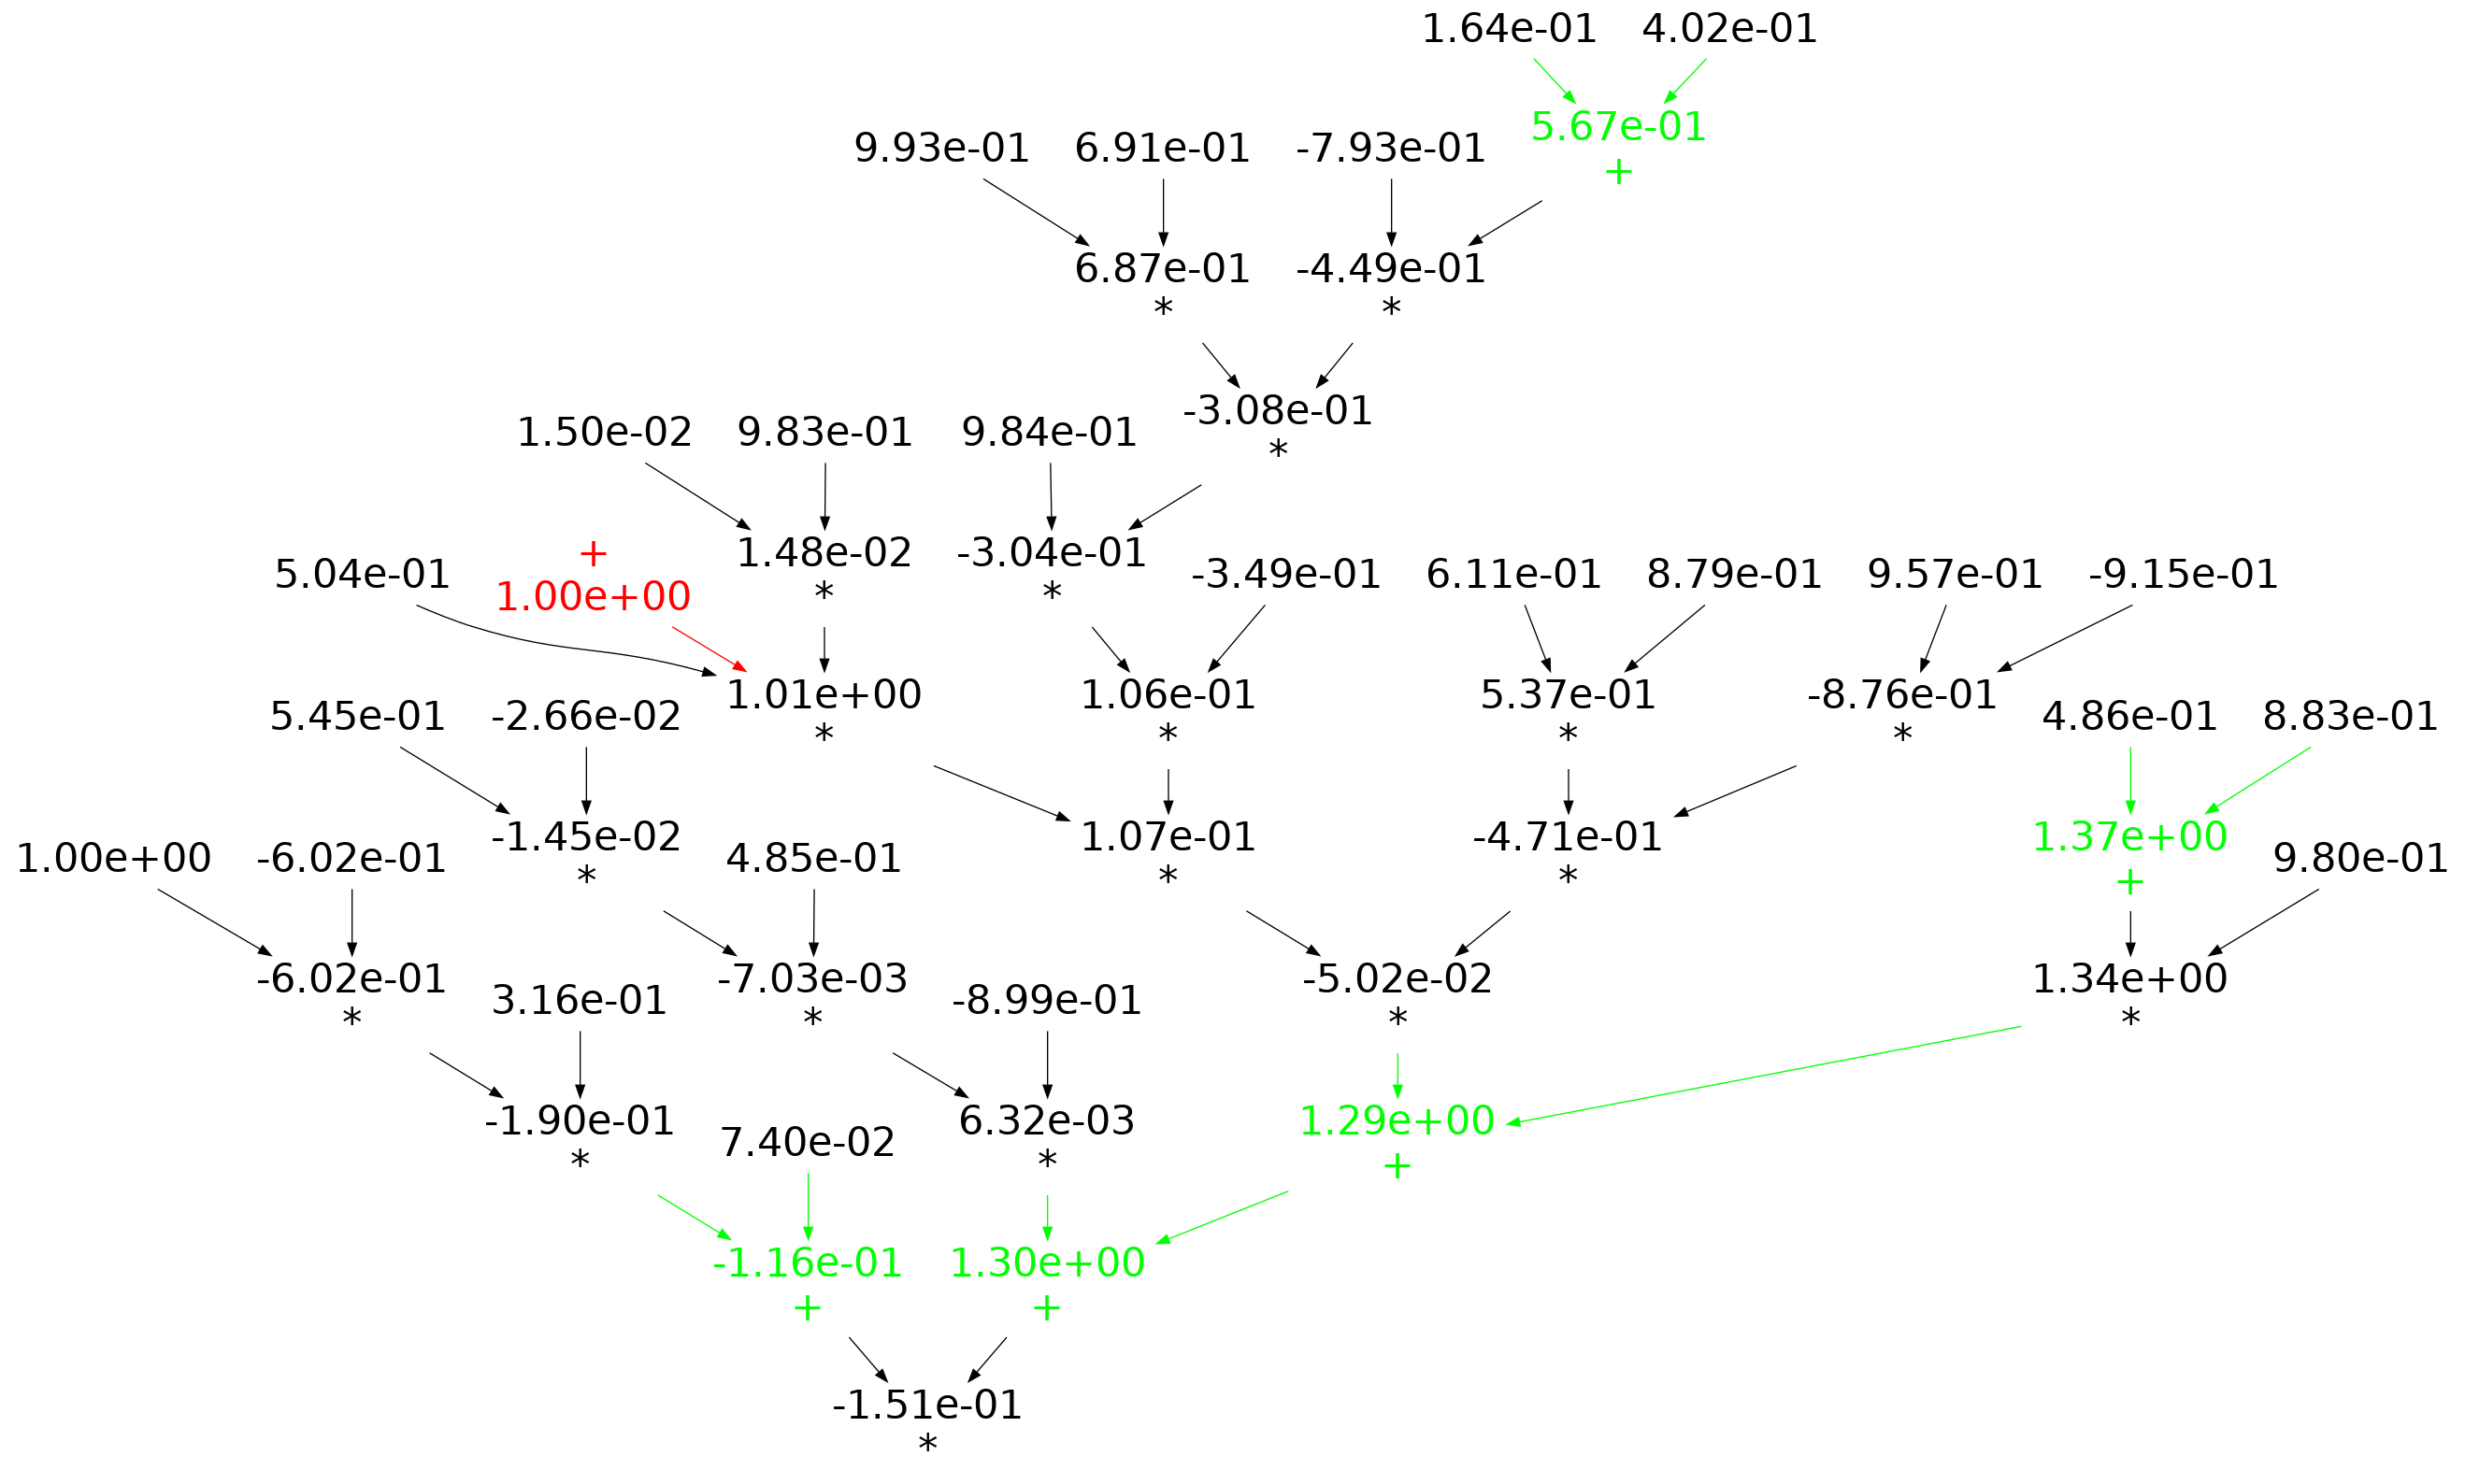
When an expression has a ‘bushy’ balanced form, there are many relatively distinct evaluation paths, the expected number of operations along a path is proportional to  . The plot below shows a randomly generated ‘bushy’ expression tree containing 25 binary operators, with 80% multiply, and randomly selected values (perturbation in red, additions in green; code+data):
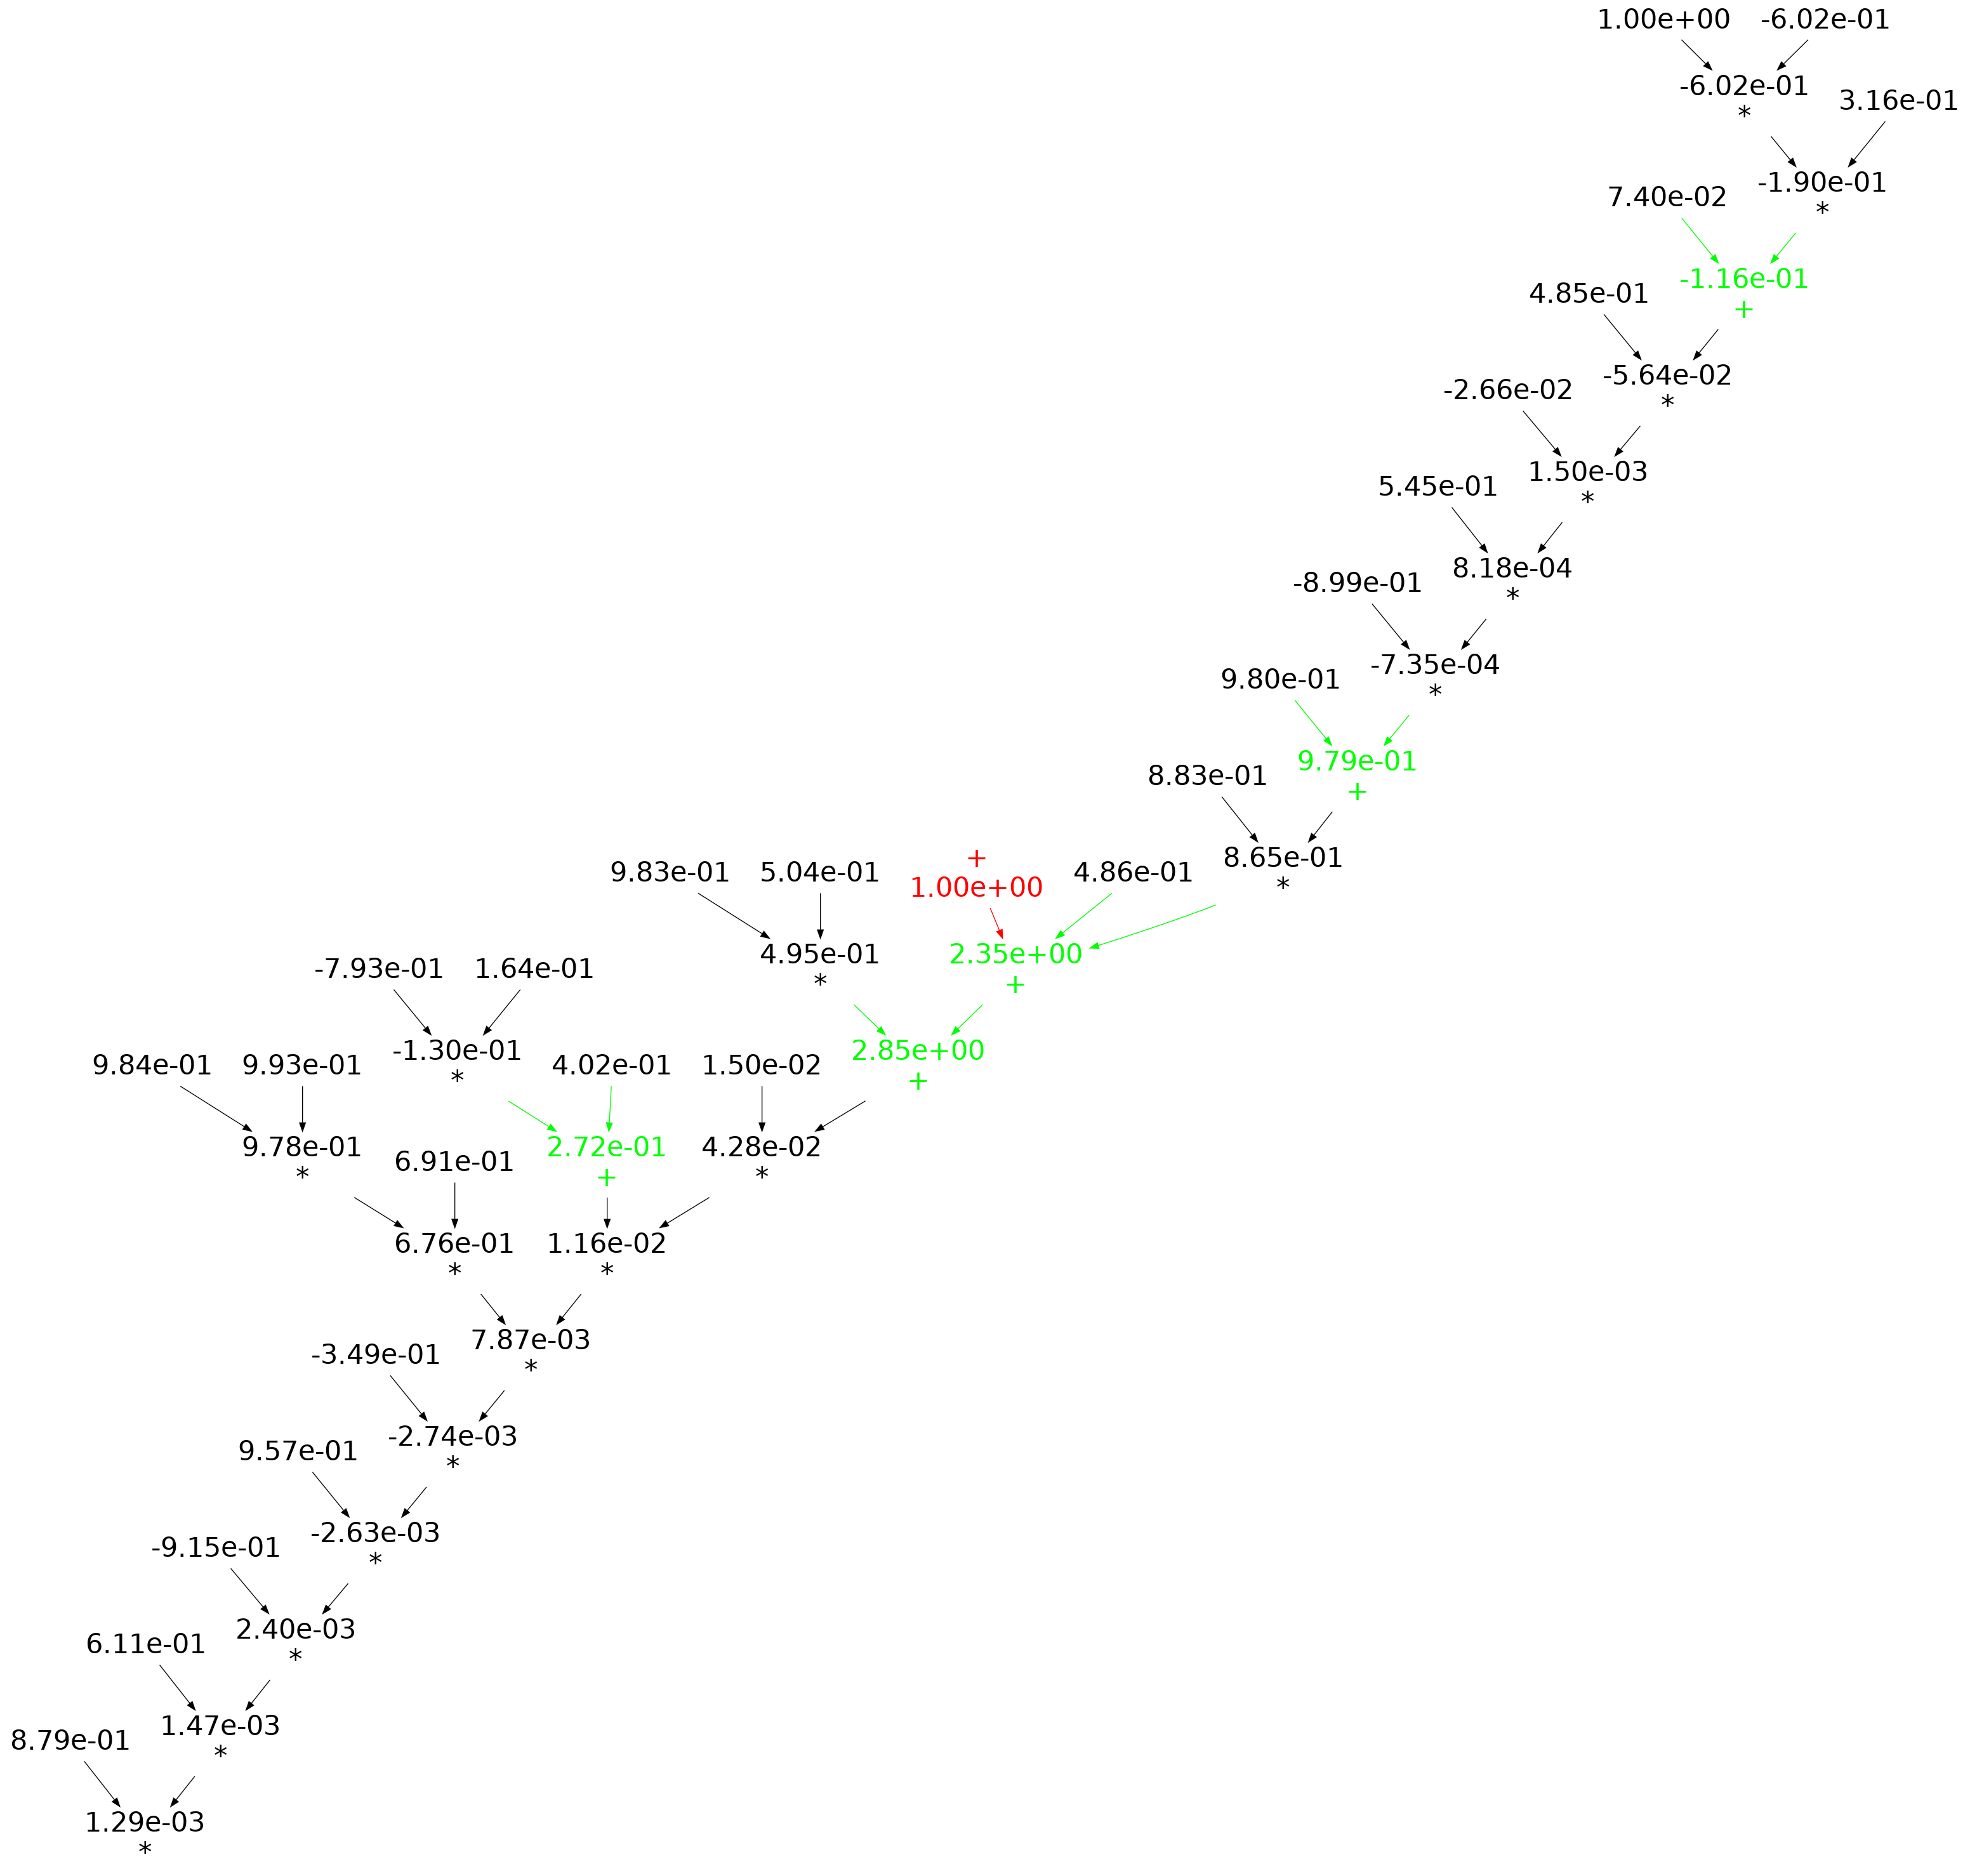
When an expression has a ‘tall’ form, there is one long evaluation path, with a few short paths hanging off it, the expected number of operations along the long path is proportional to . The plot below shows a randomly generated ‘tall’ expression tree containing 25 binary operators, with 80% multiply, and randomly selected values (perturbation in red, additions in green; code+data):
If, one by one, the result of every operator in an expression is systematically perturbed (by adding some value to it), it is known that in some cases the value of the perturbed expression is the same as the original.
The following results were obtained by generating 200 random C expressions containing some percentage of add/multiply, some number of operands (i.e., 25, 50, 75, 100, 150), one-by-one perturbing every operator in every expression, and comparing the perturbed result value to the original value. This process was repeated 200 times, each time randomly selecting operand values from a uniform distribution between -1 and 1. The perturbation values used were: 1e0, 1e2, 1e4, 1e8, 1e16. A 32-bit float type was used throughout.
Depending on the shape of the expression tree, with 80% multiplications and 100 operands, the fraction of perturbed expressions returning an unchanged value can vary from 1% to 40%.
The regression model fitted to the fraction of unchanged expressions contains lots of interactions (the simple version is that the fraction unchanged increases with more multiplications, decreases as the log of the perturbation value, the square root of the number of operands is involved; code+data):
*(sqrt{OPD}-0.007*AM)+sqrt{OPD}(0.05-0.08*AM)")
where:  is the fraction of perturbed expressions returning the original value,
  the percentage of add operators (not multiply),
  the number of operands in the expression, and
  the perturbation value.
There is a strong interaction with the shape of the expression tree, but I have not found a way of integrating this into the model.
The following plot shows the fraction of expressions unchanged by adding one, as the perturbation point moves up a tall tree, x-axis, for expressions containing 50 and 100 operands, and various percentages of multiplications (code+data):
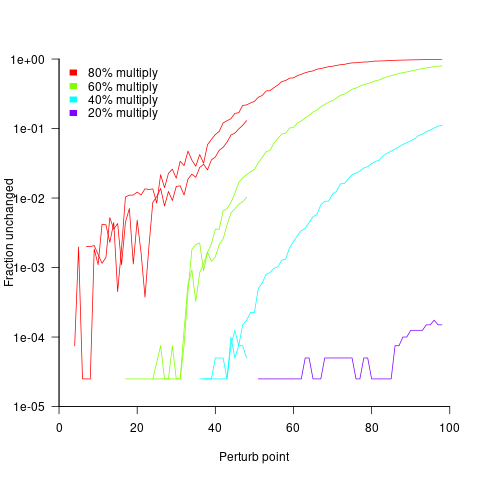
No attempt was made to count the number of expression evaluations where the perturbed value was eventually multiplied by zero (the second bullet point discussed at the start).
Human reasoning is generally not logic based
From around 350 BC until the 1960s, the students were taught that people reasoned using logic, and teachers believed this to be true. In the 1960s psychologists started running experiments that asked subjects to solve reasoning problems, the results showed that people often failed to give the answers dictated by logic.
Some recurring patterns were present in the answers given, and small changes in the wording of the question asked were found to produce different answer patterns. Very few researchers were willing to give up the idea that subjects were reasoning using logic, there must be another explanation, e.g., subjects must be interpreting the experimental questions asked in a way that differed from that assumed by the researchers. The social context of reasoning was one of the early drivers of evolutionary psychology; reasoning must provide some survival benefit by solving problems that regularly occur in natural human environments.
After a myriad of detailed theories did little more than predict small subsets of subject responses, mainstream reasoning research finally gave up the belief that logic is the default technique used by people to solve reasoning problems. Theories of reasoning behavior are now based around people estimating probabilities and picking the answer with the highest probability; this approach does a much better job of predicting common patterns in subject answers.
Experimental studies of reasoning often use psychology undergraduates as subjects (the historical norm, with Mechanical Turk workers becoming more common). While researchers may be concerned about how well undergraduate behavior mimics the general population, my concern is the extent to which these results apply to software developers. Is a necessary condition for being a professional software developer that a person, by default, uses logic to solve reasoning problems?
Of course, software developers claim that their reasoning is logic based, but then so do people in the general population (or at least the non-developers I interact with do). The dual-process theory of reasoning contains two reasoning systems, one unconscious/intuitive and the second a conscious/deliberate system; it has been said that the purpose of the second system is to come up with reasons to justify the answers produced by the first system.
Until reasoning experiments are run with professional developer subjects, we won’t know the extent to which existing results in reasoning research apply to this specialist subset of the population.
The Wason selection task is to studies of reasoning, like the fruit fly is to studies of genetics. What pattern of behavior do you show on this task (code)?
The plot below shows a set of four cards, of which you can see only the exposed face but not the hidden back. On each card, there is a number on one side and a letter on the other.
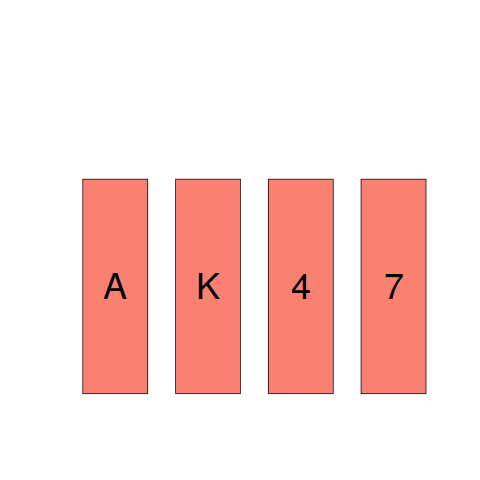
- Given the statement: “If there is a vowel on one side, then there is an even number on the other side.”
Your task is to decide, which, if any, of these four cards must be turned over to decide whether this statement is true. - Specify the cards you would turn over. Don’t turn unnecessary cards.
————————————
Most people correct specify that the card showing a vowel must be turned over to verify that an even number appears on the other side. A common mistake is to specify that the card showing an even number also has to be turned over. However, there is no requirement on the letter appearing on the other side of a card showing an even number. A second necessary condition involves a negative test (something that developers are known to overlook); for the statement to hold, a vowel must not appear on the other side of the card showing an odd number, this is the second card that must be turned over.
Focus of activities planned for 2023
In 2023, my approach to evidence-based software engineering pivots away from past years, which were about maximizing the amount of software engineering data gathered.
I plan to spend a lot more time attempting to join dots (i.e., finding useful patterns in the available data), and I also plan to spend time collecting my own data (rather than other peoples’ data).
I will continue to keep asking people for data, and I’m sure that new data will become available (and be the subject of blog posts). The amount of previously unseen data obtained by continuing to read pre-2020 papers is likely to be very small, and not worth targetting. Post-2020 papers will be the focus of my search for new data (mostly conference proceedings and arXiv’s software engineering recent submissions)
It would be great if there was an active community of evidence-based developers. The problem is that the people with the necessary skills are busily employed building real systems. I’m hopeful that people with the appropriate background and skills will come out of the woodwork.
Ideally, I would be running experiments with developer subjects; this is the only reliable way to verify theories of software engineering. While it’s possible to run small scale experiments with developer volunteers, running a workplace scale experiment will be expensive (several million pounds/dollars). I don’t move in the circles frequented by the very wealthy individuals who might fund such an experiment. So this is a back-burner project.
if-statements continue to be of great interest to me; they represent decisions that relate to requirements and tests that need to be written. I used to spend a lot of time measuring, mostly C, source code: how the same variable is tested in nested conditions, the use of else arms, and the structuring of conditions within a function. The availability of semgrep will, hopefully, enable me to measure various aspect of if-statement usage across different languages.
I hope that my readers continue to keep their eyes open for interesting software engineering data, and will let me know when they find any.
Some human biases in conditional reasoning
Tracking down coding mistakes is a common developer activity (for which training is rarely provided).
Debugging code involves reasoning about differences between the actual and expected output produced by particular program input. The goal is to figure out the coding mistake, or at least narrow down the portion of code likely to contain the mistake.
Interest in human reasoning dates back to at least ancient Greece, e.g., Aristotle and his syllogisms. The study of the psychology of reasoning is very recent; the field was essentially kick-started in 1966 by the surprising results of the Wason selection task.
Debugging involves a form of deductive reasoning known as conditional reasoning. The simplest form of conditional reasoning involves an input that can take one of two states, along with an output that can take one of two states. Using coding notation, this might be written as:
if (p) then q if (p) then !q if (!p) then q if (!p) then !q |
The notation used by the researchers who run these studies is a 2×2 contingency table (or conditional matrix):
          OUTPUT
          1    0

      1   A    B
INPUT
0 C D |
where: A, B, C, and D are the number of occurrences of each case; in code notation, p is the input and q the output.
The fertilizer-plant problem is an example of the kind of scenario subjects answer questions about in studies. Subjects are told that a horticultural laboratory is testing the effectiveness of 31 fertilizers on the flowering of plants; they are told the number of plants that flowered when given fertilizer (A), the number that did not flower when given fertilizer (B), the number that flowered when not given fertilizer (C), and the number that did not flower when not given any fertilizer (D). They are then asked to evaluate the effectiveness of the fertilizer on plant flowering. After the experiment, subjects are asked about any strategies they used to make judgments.
Needless to say, subjects do not make use of the available information in a way that researchers consider to be optimal, e.g., Allan’s  index
index -P(B vert D)=A/{A+B}-C/{C+D}") (sorry about the double,
(sorry about the double,  , rather than single, vertical lines).
What do we know after 40+ years of active research into this basic form of conditional reasoning?
The results consistently find, for this and other problems, that the information A is given more weight than B, which is given by weight than C, which is given more weight than D.
That information provided by A and B is given more weight than C and D is an example of a positive test strategy, a well-known human characteristic.
Various models have been proposed to ‘explain’ the relative ordering of information weighting: gtw(B) gt w(C) gt w(D)") , e.g., that subjects have a bias towards sufficiency information compared to necessary information.
, e.g., that subjects have a bias towards sufficiency information compared to necessary information.
Subjects do not always analyse separate contingency tables in isolation. The term blocking is given to the situation where the predictive strength of one input is influenced by the predictive strength of another input (this process is sometimes known as the cue competition effect). Debugging is an evolutionary process, often involving multiple test inputs. I’m sure readers will be familiar with the situation where the output behavior from one input motivates a misinterpretation of the behaviour produced by a different input.
The use of logical inference is a commonly used approach to the debugging process (my suggestions that a statistical approach may at times be more effective tend to attract odd looks). Early studies of contingency reasoning were dominated by statistical models, with inferential models appearing later.
Debugging also involves causal reasoning, i.e., searching for the coding mistake that is causing the current output to be different from that expected. False beliefs about causal relationships can be a huge waste of developer time, and research on the illusion of causality investigates, among other things, how human interpretation of the information contained in contingency tables can be ‘de-biased’.
The apparently simple problem of human conditional reasoning over two variables, each having two states, has proven to be a surprisingly difficult to model. It is tempting to think that the performance of professional software developers would be closer to the ideal, compared to the typical experimental subject (e.g., psychology undergraduates or Mturk workers), but I’m not sure whether I would put money on it.
A study of deceit when reporting information in a known context
A variety of conflicting factors intrude when attempting to form an impartial estimate of the resources needed to perform a task. The customer/manager, asking for the estimate, wants to hear a low value, creating business/social pressure to underestimate; overestimating increases the likelihood of completing the task within budget.
A study by Oey, Schachner and Vul investigated the strategic reasoning for deception/lying in a two-person game.
A game involved a Sender and Receiver, with the two players alternating between the roles. The game started with both subjects seeing a picture of a box containing red and blue marbles (the percentage of red marbles was either 20%, 50%, or 80%). Ten marbles were randomly selected from this ‘box’, and shown to the Sender. The Sender was asked to report to the Receiver the number of red marbles appearing in the random selection,  (there was an incentive to report higher/lower, and punishment for being caught being inaccurate). The Receiver could accept or reject the number of red balls reported by the Sender. In the actual experiment, unknown to the human subjects, one of every game’s subject pair was always played by a computer. Every subject played 100 games.
In the inflate condition: If the Receiver accepted the report, the Sender gained points, and the Receiver gained  points.
If the Receiver rejected the report, then:
- if the Sender’s report was accurate (i.e., ==
 ), the Sender gained points, and the Receiver gained
  points (i.e., a -5 point penalty),
 - if the Sender’s report was not accurate, the Receiver gained 5 points, and the Sender lost 5 points.
In the deflate condition: The points awarded to the Sender was based on the number of blue balls in the sample, and the points awarded to the Received was based on the number of red balls in the sample (i.e., the Sender had in incentive to report fewer red balls).
The plot below shows the mean rate of deceit (i.e., the fraction of a subject’s reports where  , averaged over all 116 subject’s mean) for a given number of red marbles actually seen by the Sender; vertical lines show one standard deviation, calculated over the mean of all subjects (code+data):
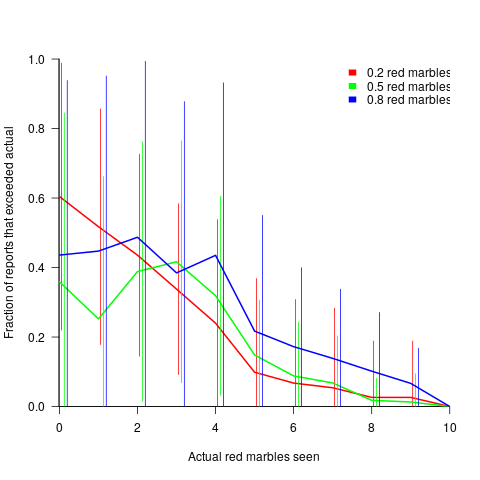
Subjects have some idea of the percentage of red/blue balls, and are aware that their opponent has a similar idea.
The wide variation in the fraction of reports where a subject reported a value greater than the number of marbles seen, is likely caused by variation in subject level of risk aversion. Some subjects may have decided to reduce effort by always accurately reporting, while others may have tried to see how much they could get away with.
The wide variation is particularly noticeable in the case of a box containing 80% red. If a Sender’s random selection contains few reds, then the Sender can feel confident reporting to have seen more.
The general pattern shows subjects being more willing to increase the reported number when they are supplied with few.
There is a distinct change of behavior when half of the sample contains more than five red marbles. In this situation, subjects may be happy to have been dealt a good hand, and are less inclined to risk losing 5-points for less gain.
Estimating involves considering more factors than the actual resources likely to be needed to implement the task; the use of round numbers is one example. This study is one of few experimental investigations of numeric related deception. The use of students having unknown motivation is far from ideal, but they are better than nothing.
When estimating in a team context, there is an opportunity to learn about the expectations of others and the consequences of over/under estimating. An issue for another study 🙂
Clustering source code within functions
The question of how best to cluster source code into functions is a perennial debate that has been ongoing since functions were first created.
Beginner programmers are told that clustering code into functions is good, for a variety of reasons (none of the claims are backed up by experimental evidence). Structuring code based on clustering the implementation of a single feature is a common recommendation; this rationale can be applied at both the function/method and file/class level.
The idea of an optimal function length (measured in statements) continues to appeal to developers/researchers, but lacks supporting evidence (despite a cottage industry of research papers). The observation that most reported fault appear in short functions is a consequence of most of a program’s code appearing in short functions.
I have had to deal with code that has not been clustered into functions. When microcomputers took off, some businessmen taught themselves to code, wrote software for their line of work and started selling it. If the software was a success, more functionality was needed, and the businessman (never encountered a woman doing this) struggled to keep on top of things. A common theme was a few thousand lines of unstructured code in one function in a single file (keeping everything in one file is also a trait of highly focus developers).
Adding structural bureaucracy (e.g., functions and multiple files) reduced the effort needed to maintain and enhance the code.
The problem with ‘born flat’ source is that the code for unrelated functionality is often intermixed, and global variables are freely used to communicate state. I have seen the same problems in structured function code, but instances are nowhere near as pervasive.
When implementing the same program, do different developers create functions implementing essentially the same functionality?
I am aware of two datasets relating to this question: 1) when implementing the same small specification (average length program 46.3 lines), a surprising number of variants (6,301) are created, 2) an experiment that asked developers to reintroduce functions into ‘flattened’ code.
The experiment (Alexey Braver’s MSc thesis) took an existing Python program, ‘flattened’ it by inlining functions (parameters were replaced by the corresponding call arguments), and asked subjects to “… partition it into functions in order to achieve what you consider to be a good design.”
The 23 rows in the plot below show the start/end (green/brown delimited by blue lines) of each function created by the 23 subjects; red shows code not within a function, and right axis is percentage of each subjects’ code contained in functions. Blue line shows original (currently plotted incorrectly; patched original code+data):
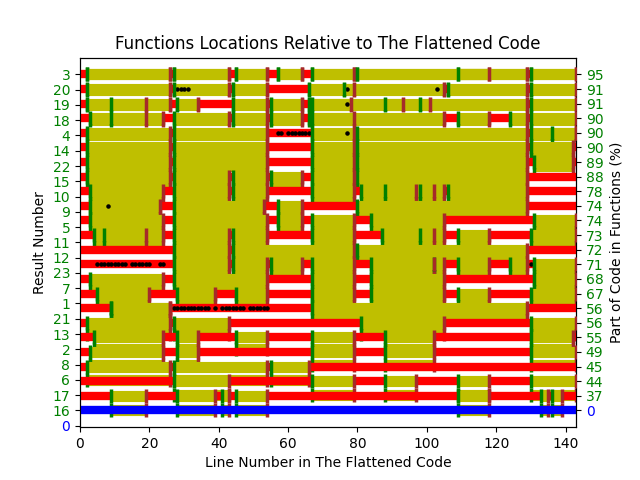
There are many possible reasons for the high level of agreement between subjects, including: 1) the particular example chosen, 2) the code was already well-structured, 3) subjects were explicitly asked to create functions, 4) the iterative process of discovering code that needs to be written did not occur, 5) no incentive to leave existing working code as-is.
Given that most source has a short and lonely existence, is too much time being spent bike-shedding function contents?
Given how often lower level design time happens at code implementation time, perhaps discussion of function contents ought to be viewed as more about thinking how things fit together and interact, than about each function in isolation.
Analyzing each function in isolation can create perverse incentives.
Shopper estimates of the total value of items in their basket
Agile development processes break down the work that needs to be done into a collection of tasks (which may be called stories or some other name). A task, whose implementation time may be measured in hours or a few days, is itself composed of a collection of subtasks (which may in turn be composed of subsubtasks, and so on down).
When asked to estimate the time needed to implement a task, a developer may settle on a value by adding up estimates of the effort needed to implement the subtasks thought to be involved. If this process is performed in the mind of the developer (i.e., not by writing down a list of subtask estimates), the accuracy of the result may be affected by the characteristics of cognitive arithmetic.
Humans have two cognitive systems for processing quantities, the approximate number system (which has been found to be present in the brain of many creatures), and language. Researchers studying the approximate number system often ask subjects to estimate the number of dots in an image; I recently discovered studies of number processing that used language.
In a study by Benjamin Scheibehenne, 966 shoppers at the checkout counter in a grocery shop were asked to estimate the total value of the items in their shopping basket; a subset of 421 subjects were also asked to estimate the number of items in their basket (this subset were also asked if they used a shopping list). The actual price and number of items was obtained after checkout.
There are broad similarities between shopping basket estimation and estimating task implementation time, e.g., approximate idea of number of items and their cost. Does an analysis of the shopping data suggest ideas for patterns that might be present in software task estimate data?
The left plot below shows shopper estimated total item value against actual, with fitted regression line (red) and estimate==actual (grey); the right plot shows shopper estimated number of items in their basket against actual, with fitted regression line (red) and estimate==actual (grey) (code+data):
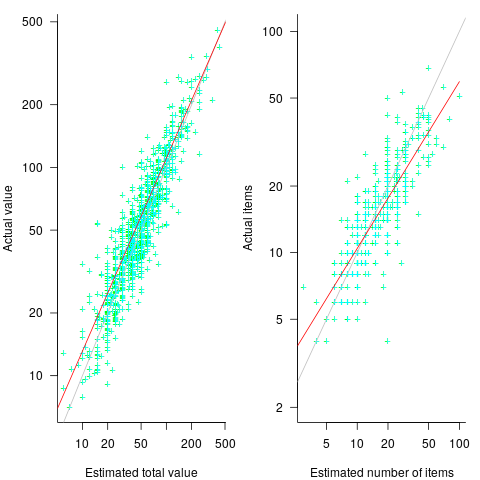
The model fitted to estimated total item value is:  , which differs from software task estimates/actuals in always underestimating over the range measured; the exponent value,
  , is at the upper range of those seen for software task estimates.
The model fitted to estimated number of items in the basket is:  . This pattern, of underestimating small values and overestimating large values is seen in software task estimation, but the exponent of
  is much smaller.
Including the estimated number of items in the shopping basket,  , in a model for total value produces a slightly better fitting model:
  , which explains 83% of the variance in the data (use of a shopping list had a relatively small impact).
The accuracy of a software task implementation estimate based on estimating its subtasks dependent on identifying all the subtasks, or having a good enough idea of the number of subtasks. The shopping basket study found a pattern of inaccuracies in estimates of the number of recently collected items, which has been seen before. However, adding to the Shopping model only reduced the unexplained variance by a few percent.
Would the impact of adding an estimate of the number of subtasks to models of software task estimates also only be a few percent? A question to add to the already long list of unknowns.
Like task estimates, round numbers were often given as estimate values; see code+data.
The same study also included a laboratory experiment, where subjects saw a sequence of 24 numbers, presented one at a time for 0.5 seconds each. At the end of the sequence, subjects were asked to type in their best estimate of the sum of the numbers seen (other studies asked subjects to type in the mean). Each subject saw 75 sequences, with feedback on the mean accuracy of their responses given after every 10 sequences. The numbers were described as the prices of items in a shopping basket. The values were drawn from a distribution that was either uniform, positively skewed, negatively skewed, unimodal, or bimodal. The sequential order of values was either increasing, decreasing, U-shaped, or inversely U-shaped.
Fitting a regression model to the lab data finds that the distribution used had very little impact on performance, and the sequence order had a small impact; see code+data.
Impact of number of files on number of review comments
Code review is often discussed from the perspective of changes to a single file. In practice, code review often involves multiple files (or at least pull-based reviews do), which begs the question: Do people invest less effort reviewing files appearing later?
TLDR: The number of review comments decreases for successive files in the pull request; by around 16% per file.
The paper First Come First Served: The Impact of File Position on Code Review extracted and analysed 219,476 pull requests from 138 Java projects on Github. They also ran an experiment which asked subjects to review two files, each containing a seeded coding mistake. The paper is relatively short and omits a lot of details; I’m guessing this is due to the page limit of a conference paper.
The plot below shows the number of pull requests containing a given number of files. The colored lines indicate the total number of code review comments associated with a given pull request, with the red dots showing the 69% of pull requests that did not receive any review comments (code+data):
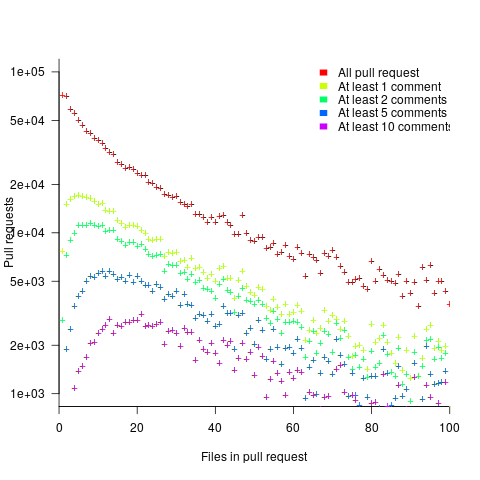
Many factors could influence the number of comments associated with a pull request; for instance, the number of people commenting, the amount of changed code, whether the code is a test case, and the number of files already reviewed (all items which happen to be present in the available data).
One factor for which information is not present in the data is social loafing, where people exert less effort when they are part of a larger group; or at least I did not find a way of easily estimating this factor.
The best model I could fit to all pull requests containing less than 10 files, and having a total of at least one comment, explained 36% of the variance present, which is not great, but something to talk about. There was a 16% decline in comments for successive files reviewed, test cases had 50% fewer comments, and there was some percentage increase with lines added; number of comments increased by a factor of 2.4 per additional commenter (is this due to importance of the file being reviewed, with importance being a metric not present in the data).
The model does not include information available in the data, such as file contents (e.g., Java, C++, configuration file, etc), and there may be correlated effects I have not taken into account. Consequently, I view the model as a rough guide.
Is the impact of file order on number of comments a side effect of some unrelated process? One way of showing a causal connection is to run an experiment.
The experiment run by the authors involved two five files, each with the first and last containing one seeded coding mistake. The 102 subjects were asked to review the two five files, with mistake file order randomly selected. The experiment looks well-structured and thought through (many are not), but the analysis of the results is confused.
The good news is that the seeded coding mistake in the first file was much more likely to be detected than the mistake in the second last file, and years of Java programming experience also had an impact (appearing first had the same impact as three years of Java experience). The bad news is that the model (a random effect model using a logistic equation) explains almost none of the variance in the data, i.e., these effects are tiny compared to whatever other factors are involved; see code+data.
What other factors might be involved?
Most experiments show a learning effect, in that subject performance improves as they perform more tasks. Having subjects review many pairs of files would enable this effect to be taken into account. Also, reviewing multiple pairs would reduce the impact of random goings-on during the review process.
The identity of the seeded mistake did not have a significant impact on the model.
Review comments are an important issue which is amenable to practical experimental investigation. I hope that the researchers run more experiments on this issue.
Estimating quantities from several hundred to several thousand
How much influence do anchoring and financial incentives have on estimation accuracy?
Anchoring is a cognitive bias which occurs when a decision is influenced by irrelevant information. For instance, a study by John Horton asked 196 subjects to estimate the number of dots in a displayed image, but before providing their estimate subjects had to specify whether they thought the number of dots was higher/lower than a number also displayed on-screen (this was randomly generated for each subject).
How many dots do you estimate appear in the plot below?

Estimates are often round numbers, and 46% of dot estimates had the form of a round number. The plot below shows the anchor value seen by each subject and their corresponding estimate of the number of dots (the image always contained five hundred dots, like the one above), with round number estimates in same color rows (e.g., 250, 300, 500, 600; code+data):
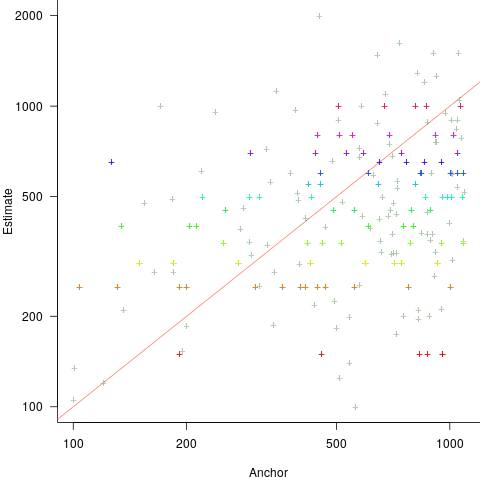
How much influence does the anchor value have on the estimated number of dots?
One way of measuring the anchor’s influence is to model the estimate based on the anchor value. The fitted regression equation  explains 11% of the variance in the data. If the higher/lower choice is included the model, 44% of the variance is explained; higher equation is:
  and lower equation is:
  (a multiplicative model has a similar goodness of fit), i.e., the anchor has three-times the impact when it is thought to be an underestimate.
How much would estimation accuracy improve if subjects’ were given the option of being rewarded for more accurate answers, and no anchor is present?
A second experiment offered subjects the choice of either an unconditional payment of $2.50 or a payment of $5.00 if their answer was in the top 50% of estimates made (labelled as the risk condition).
The 196 subjects saw up to seven images (65 only saw one), with the number of dots varying from 310 to 8,200. The plot below shows actual number of dots against estimated dots, for all subjects; blue/green line shows  , and red line shows the fitted regression model
  (code+data):
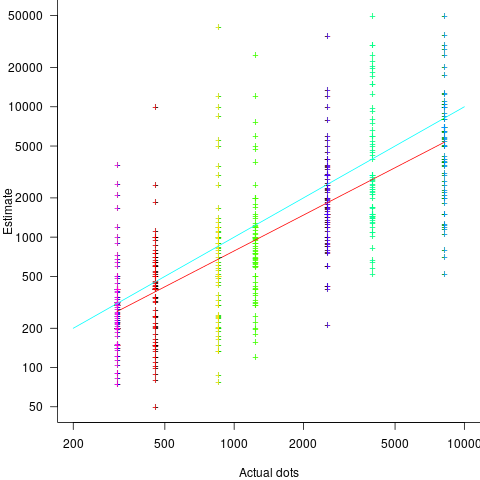
The variance in the estimated number of dots is very high and increases with increasing actual dot count, however, this behavior is consistent with the increasing variance seen for images containing under 100 dots.
Estimates were not more accurate in those cases where subjects chose the risk payment option. This is not surprising, performance improvements require feedback, and subjects were not given any feedback on the accuracy of their estimates.
Of the 86 subjects estimating dots in three or more images, 44% always estimated low and 16% always high. Subjects always estimating low/high also occurs in software task estimates.
Estimation patterns previously discussed on this blog have involved estimated values below 100. This post has investigated patterns in estimates ranging from several hundred to several thousand. Patterns seen include extensive use of round numbers and increasing estimate variance with increasing actual value; all seen in previous posts.
Recent Comments