Archive
Survey of instruction selection
A well written survey of compiler instruction selection has just become available, the first major survey of this topic in 30 years! The academic outlook of the author is given away by the evaluation “…the technique appears to have had very limited impact as the citation count for the paper is low.” and coverage for the last 10 years does tend to thin out (but that could fill another 100 pages). Whatever your interest in compilers this survey is well worth a read.
Anybody reading a compiler book could be forgiven for thinking that instruction set selection was a minor issue; Gabriel Hjort Blindell counted 160 pages devoted to the topic out of 4,600 pages in seven well known compiler books. In a production compiler it is the parsing and semantics that consume 3% of the code with optimization and code generation making up the other 97%.
A 100 page survey of register allocation is also overdue (20 pages is a bit short).
Instruction set selection is one quarter of code generation, another quarter being register allocation and the remaining half being how these two are woven together (Hjort Blindell lists instruction scheduling as a third component and we could all argue for hours about whether this is another optimization, something that is spread over instruction selection/register allocation or a distinct component).
For a given choice of registers there are algorithms that will select the optimal code and for a given sequence of code there are algorithms that will select the optimal registers to use. Papers covering the optimal selection of both registers and instructions are thin on the ground; this is something of a black art that is picked up by building a production compiler.
Apps in Space Hackathon
I went along to the Satellite Applications hackathon last weekend. As a teenager I was very much into space flight and with this event being only 30 miles away how could I not attend. Around 25 or so hackers turned up, supported by seven or so knowledgeable and motivated people from the organizers/sponsors. Excellent food+drink, including sending out for Indian/Chinese for dinner. The one important item in short supply was example data to experiment with; the organizers are aware of this and plan to have a lot more data available at the next event.
The rationale for the event is to encourage the creation of business activities in the UK around the increasing amount of data beamed to Earth from satellites. At the moment a satellite image costs something like £100 if its in the back catalog and £10,000 if you want them to take one just for you; the price of images in the back catalog is about to plummet (new satellites coming on stream) and a company is being set up to act as a one stop shop+good user interface for pics (at the moment customers have to talk to a variety of suppliers to find see what’s available). I was excited to hear that I could have my own satellite launched for £100,000, the catch being that they are a bit more expensive to build.
Making use of satellite data requires other data plus support software. Many of the projects people decided to work on needed access to mapping data, e.g., which road is closest to this latitude/longitude. Open Streetmap is the obvious source of mapping data, the UK’s Ordinance Survey have also made some data freely available for public/commercial use. The current problem with this data is the lack of support libraries designed to handle satellite related queries (e.g., return nearest road, town, etc), the existing APIs are good for creating mapping images and dealing with routing.
Support for very large images is one area where existing tools are going to need an upgrade; by very large I mean single image files measured in gigabytes. I did not manage to view any gigabyte image files on my laptop (with 4G of ram), even after going for a coffee and sitting talking to somebody waiting for it to cool before drinking it, still a black rectangle. If the price of satellite images plummets and are easy to buy online, then I can imagine them becoming a discretionary item that people buy for a bit of fun and will then want to view using the devices they already own; telling them that this is not sensible is the wrong answer, the customer is always right and it has to be made to work.
One area where there is good software tool support is working out where satellites will appear in the sky; this is really an astronomical application and there are lots of astronomical tools out there. The Python crowd will be happy to know that scientific-grade astronomy routines are available in Pyephem.
For the most part the hacks created are bullet points of ideas and things to do. The team working on calculating the satellite beam likely to have the strongest signal at a given point on the Earth’s surface made a lot more progress than anybody else. This is because they had an existing Python library to use and ‘only’ needed to apply the trigonometry that we all learn in school.
Some suggestions for the organizers:
- put lightening talks on existing technologies and some of their uses on the agenda (the brief presentation given on SAR was eye opening),
- make some good example data public, i.e., downloadable for all to use. This is the only way to get lots of library support written,
- create cut-down datasets that are usable on laptops. At a Hackathon people can only productively use what they know well and requiring them to use something unfamiliar, such as a virtual machine, is a major road block,
- allow external users to take part, why limit your potential customer base to what can be fitted into a medium size room?
Hiring experts is cheaper in the long run
The SAMATE (Software Assurance Metrics And Tool Evaluation) group at the US National Institute of Standards and Technology recently started hosting a new version of test suites for checking how good a job C/C++/Java static analysis tools do at detecting vulnerabilities in source code. The suites were contributed by the NSA‘s Center for Assured Software.
Other test suites hosted by SAMATE contain a handful of tests and have obviously been hand written, one for each kind of vulnerability. These kind of tests are useful for finding out whether a tool detects a given problem or not. In practice problems occur within a source code context (e.g., control flow path) and a tool’s ability to detect problems in a wide range of contexts is a crucial quality factor. The NSA’s report on the methodology used looked good and with the C/C++ suite containing 61,387 tests it was obviously worth investigating.
Summary: Not a developer friendly test suite that some tools will probably fail to process because it exceeds one of their internal limits. Contains lots of minor language infringements that could generate many unintended (and correct) warnings.
Recommendation: There are people in the US who know how to write C/C++ test suites, go hire some of them (since this is US government money there are probably rules that say it has to go to US companies).
I’m guessing that this test suite was written by people with a high security clearance and a better than average knowledge of C/C++. For this kind of work details matter and people with detailed knowledge are required.
Another recommendation: Pay compiler vendors to add checks to their compilers. The GCC people get virtually no funding to do front end work (nearly all funding comes from vendors wanting backend support). How much easier it would be for developers to check their code if they just had to toggle a compiler flag; installing another tool introduces huge compatibility and work flow issues.
I had this conversation with a guy from GCHQ last week (the UK equivalent of the NSA) who are in the process of spending £5 million over the next 3 years on funding research projects. I suspect a lot of this is because they want to attract bright young things to work for them (student sponsorship appears to be connected with the need to pass a vetting process), plus universities are always pointing out how more research can help (they are hardly likely to point out that research on many of the techniques used in practice was done donkey’s years ago).
Some details
Having over 379,000 lines in the main function is not a good idea. The functions used to test each vulnerability should be grouped into a hierarchy; main calling functions that implement say the top 20 categories of vulnerability, each of these functions containing calls to the next level down and so on. This approach makes it easy for the developer to switch in/out subsets of the tests and also makes it more likely that the tool will not hit some internal limit on function size.
The following log string is good in theory but has a couple of practical problems:
printLine("Calling CWE114_Process_Control__w32_char_connect_socket_03_good();"); CWE114_Process_Control__w32_char_connect_socket_03_good(); |
C89 (the stated version of the C Standard being targeted) only requires identifiers to be significant to 32 characters, so differences in the 63rd character might be a problem. From the readability point of view it is a pain to have to check for values embedded that far into a string.
Again the overheads associated with storing so many strings of that length might cause problems for some tools, even good ones that might be doing string content scanning and checking.
The following is a recurring pattern of usage and has undefined behavior that is independent of the vulnerability being checked for. The lifetime of the variable shortBuffer terminates at the curly brace, }, and who knows what might happen if its address is accessed thereafter.
data = NULL; { /* FLAW: Point data to a short */ short shortBuffer = 8; data = &shortBuffer; } CWE843_Type_Confusion__short_68_badData = data; |
A high quality tool would report the above problem, which occurs in several tests classified as GOOD, and so appear to be failing (i.e., generating a warning when none should be generated).
The tests contain a wide variety of minor nits like this that the higher quality tools are likely to flag.
Data cleaning: The next step in empirical software engineering
Over the last 10 years software engineering researchers have gone from a state of data famine to being deluged with data. Until recently these researchers have been acting like children at a birthday party, rushing around unwrapping all the presents to see what is inside and quickly moving onto the next one. A good example of this are those papers purporting to have found a power law relationship between two constructs by simply plotting the data using log axis and drawing a straight line through the data; hey look, a power law, isn’t that interesting? Hopefully, these days, reviewers are starting to wise up and insist that any claims of a power law be checked.
Data cleaning is a very important topic that unfortunately appears to be missing from many researchers’ approach to data analysis. The quality of a model built from data is only as good as the quality of the data used to build it. Anybody who is interested in building models that connect to the real world of software engineering, rather than just getting another paper published, has to consider the messiness that gets added to data by the software developers who are intimately involved in the processes that generated the artifacts (e.g., source code, bug reports).
I have jut been reading a paper containing some unsettling numbers (It’s not a Bug, it’s a Feature: On the Data Quality of Bug Databases). A manual classification of over 7,000 issues reported against various large Java applications found that 42.6% of the issues were misclassified (e.g., a fault report was actually a request for enhancement), resulting in a change of status of 39% of the files once thought to contain a fault to not actually containing a fault (any fault prediction models built assuming the data in the fault database was correct now belong in the waste bin).
What really caught my eye about this research was the 725 hours (90 working days) invested by the researchers doing the manual classification (one person + independent checking by another). Anybody can extracts counts of this that and the other from the many repositories now freely available, generate fancy looking plots from them and add in some technobabble to create a paper. Real researchers invest lots of their time figuring out what is really going on.
These numbers are a wakeup call for all software engineering researchers. The data you are using needs to be thoroughly checked and be prepared to invest a lot of time doing it.
Arm waver or expert?
I was at a workshop yesterday where one of the speakers claimed his tool supported all of Standard C; needless to say I went over to chat during one of the breaks. Now a lot of the time speakers will immediately admit to implementing a subset when chatting over coffee, but this guy was claiming all of Standard C and had a very favorable opinion of his own expertise. It is impolite and somewhat confrontational to stand in front of somebody with a checklist of questions; what topic should be worked into the conversation to best gauge whether a person really does have a detailed grasp of C?
I tossed the phrase strictly conforming into the conversation and a bit later integer promotions, these resulted in just more huff and puff from him. Now people with a detailed knowledge of C are thin on the ground and an encounter with one usually results in a warm mutual exchange of war stories on the problems encountered during the implementation of some feature or other. Perhaps this guy’s tool had been implemented by a student and this was not part of the message; perhaps this was his first encountered with somebody who also had a detailed knowledge of the language and he did not know how to react (I imagine such people are even rarer in academia than industry).
Thinking about it on the train home I decided that “sequenced before” is the phrase I should have tossed into the conversation. The concept of sequence points existed in C90 and C99, but was replaced by “sequenced before” and unsequenced in C11 (a more complicated memory ordering model was necessitated by the newly added support for sharing objects between processes). Yesterday’s speaker was not there today, so I was not able to reinvestigate whether his knowledge was pre/post C11 or just bluster.
The C++ phrase to toss into a conversation used to be One definition rule, but I don’t know if this is still true today. I once saw an email exchange where a supposed expert had never heard about the “one definition” rule and jokingly asked if it was connected to the “one ring” in Lord of the Rings; oops, he had obviously never read the C++ Standard.
What about other languages? Suggestions for phrases I might use to gauge whether somebody really is an expert in some other language welcome (this would be pure bluff on my part and I accept the consequences of using any suggestion).
Preferential attachment applied to frequency of accessing a variable
If, when writing code for a function, up to the current point in the code  distinct local variables have been accessed for reading
  times (
 ), will the next read access be from a previously unread local variable and if not what is the likelihood of choosing each of the distinct variables (global variables are ignored in this analysis)?
Short answer:
- With probability
 select a new variable to access,
 - otherwise select a variable that has previously been accessed in the function, with the probability of selecting a particular variable being proportional to
 (where
  is the number of times the variable has previously been read from.
The longer answer is below as another draft section from my book Empirical software engineering with R. As always comments and pointers to more data welcome. R code and data here.
The discussion on preferential attachment is embedded in a discussion of model building.
What kind of model to build?
The obvious answer to the question of what kind of model to build is, the cheapest one that produces the desired output.
Many of the model building techniques discussed in this book find patterns in the data and effectively return one or more equations that produce output similar to the data given some set of inputs; the equations are the model.
The advantage of this approach is that in many cases the implementation of the model building has been automated (I don’t say much about those that have not yet been automated), the user contribution is in choosing which kind of model to build. In some cases the R function requires that the user provide a general direction of attack (e.g., the form of function to use in fitting a nonlinear regression).
An alternative kind of model is one whose output is obtained by running an iterative algorithm, e.g., a time series created by calculating the next value in a sequence from one or more previous values.
In most cases a great deal of domain knowledge is required of the user building the model, while in a few cases an automated procedure for creating the iterative algorithm and its parameters is available, e.g., time series analysis.
There is never any guarantee that any created model will be sufficiently accurate to be useful for the problem at hand; this is a risk that occurs in all model building exercises.
The following discussion builds two models, one using an established automated model building technique (regression) and the other using an iterative algorithm built using domain knowledge coupled with experimentation.
The problem
Consider local variable usage within a function. If a function contains a total of  read accesses to locally defined variables, how many variables will be read from only once, how many twice and so on (this is a static count extracted from the source code, not a dynamic count obtained by executing the function)?
The data for the following analysis is from Jones <book Jones_05a> (see figure 1821.5) and contains three columns, total count: the total number of read accesses to all variables defined within a function definition, object access: the number of read accesses from a distinct local variable, and occurrences: the number of distinct variables that have at least one read access within the function (i.e., unused variables are not counted); the occurrences counts have been summed over all functions.
In the following extract, within functions containing 24 totals accesses there were 783 occurrences of variables accessed once, 697 occurrences of variables accessed twice and so on.
total access,object access,occurrences 24,1,783 24,2,697 24,3,474 |
The data excludes everything about source code apart from read access information.
Fitting an equation to the data
Plotting the data shows an exponential-like decrease in occurrences as the number of accesses to a variable increases (i.e., most variables are accessed a small number of time); also there is an overall increase in the counts as the total numbers of accesses increases (see below).
The fit obtained by the nls function for a simple exponential equation is the following (all p-values less than  ; see rexample[local-use]):
where  is the number of read accesses to a given variable and is the total accesses to all local variables within the function. Because the data has been normalised the value returned is a percentage.
As an example, a function containing a total of 30 read accesses of local variables the expected percentage of variables accessed twice is:  .
.
Modeling with an incremental algorithm
If, when writing code for a function, up to the current point in the code distinct local variables have been accessed for reading times (), will the next read access be from a previously unread local variable and if not what is the likelihood of choosing each of the distinct variables (global variables are ignored in this analysis)?
Each access in the code of a local variable could be thought of as a link to the information contained in that variable. One algorithm that has been found to do a reasonable job of modeling the number of links between web pages is Preferential attachment. Might this algorithm also be applicable to modeling read accesses to local variables?
The Preferential attachment algorithm is:
- With probability
 select a new web page (in this case a new variable to access),
 - with probability
 select an existing web page (a variable that has previously been accessed in the function), select a variable with a probability proportional to the number of times it has previously been accessed (i.e., a variable that has four previous read accesses is twice as likely to be chosen as one that has had two previous accesses).
The following plot shows the results of running this algorithm 1,000 times each with 100 total accesses per function definition, for two values of (left plot 0.05, right plot 0.0004, red points) and smoothed data (blue points; smoothing involved summing the access counts for all measured functions having total accesses between 96 and 104), green line is a fitted exponential. Values have been normalised so that variables with one access have a count of 100, also access counts greater than 20 have a very low occurrences and are not plotted.
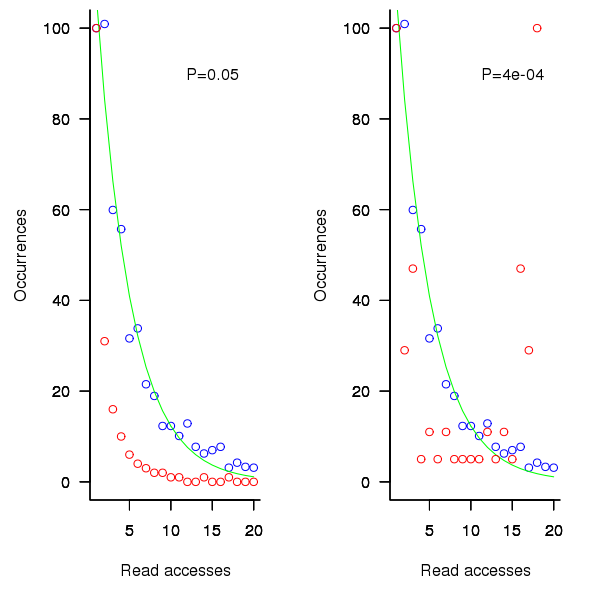
Figure 1. Variables having a given number of read accesses, given 100 total accesses, calculated from running the preferential attachment algorithm with probability of accessing a new variable at 0.05 (left, in red) and 0.0004 (right, in red), the smoothed data (blue) and a fitted exponential (green).
The results show that decreasing the probability of accessing a new variable, , does not shift the distribution of occurrences in the desired way. Note: the well known analytic solution to the outcome of running the preferential attachment algorithm, i.e., a power law, applies in the situation where the number of accesses per function definition goes to infinity.
The Preferential attachment algorithm uses a fixed probability for deciding whether to access a new variable; other measurements <book Jones_05a> imply that in practice this probability decreases as the number of distinct local variables increases. An obvious modification is to use a probability having a form something like
the number of distinct variables accessed so far). A little experimentation finds that produces results that more closely mimic the data.
While improves the fit for infrequently accessed variables, the weighting system used to select a previously accessed variable still needs attention; perhaps it also has a dependency on . Some experimentation finds that changing the probability of selection from to  (where is the number of read accesses to variable
  so far) produces behavior that matches the data to the same degree as the exponential model.
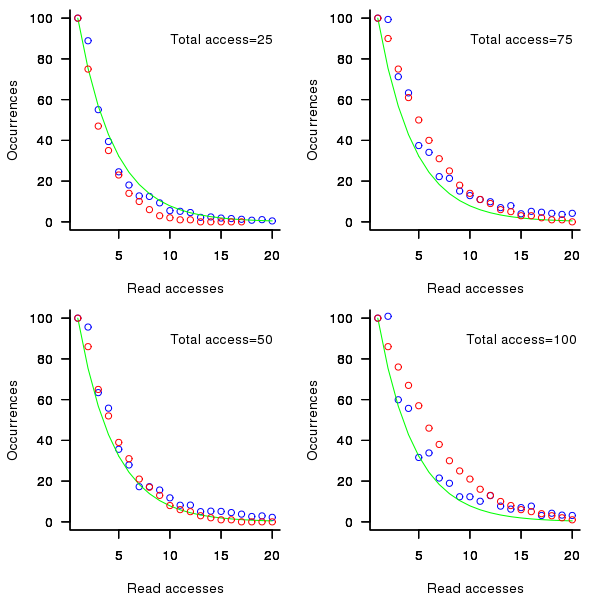
Figure 2. Variables having a given number of read accesses, given 25, 50, 75 and 100 total accesses, calculated from running the weighted preferential attachment algorithm (red), the smoothed data (blue) and a fitted exponential (green).
The weighted preferential attachment algorithm is as follows:
- With probability select a new variable to access,
- with probability
 select a variable that has previously been accessed in the function, select an existing variable with probability proportional to (where is the number of times the variable has previously been read from; e.g., if the total accesses up to this point in the code is 12, a variable that has had four previous read accesses is
  times as likely to be chosen as one that has had two previous accesses).
So what?
Both of the models are wrong in that they do not account for the small number of very frequently accessed variables that regularly occur in the data. However, as the adage goes: All models are wrong but some are useful; usefulness being evaluated by the extent to which a model solves the problem at hand. Both models have their own advantages and disadvantages, including:
- the fitted equation is quick and simple to calculate, while the output from the algorithmic model has to be averaged over many runs (1,000 are used in the example code) and is much slower,
- the algorithm automatically generates a possible sequence of accesses, while the equation does not provide an obvious way for generating a sequence of accesses,
- multiple executions of the algorithm can be used to obtain an estimate of standard deviation, while the equation does not provide a method for estimating this quantity (it may be possible to build another regression model that provides this information),
If insight into variable usage is the aim, each model provides its own particular kind of insight:
- the equation provides an end result way of thinking about how the number of variables having a given number of accesses changes, but does not provide any insight into the decision process at the level of individual accesses,
- the algorithm provides a way of thinking about how choices are made for each access, but does not provide any insight into the behavior of the final counts.
Other application domains and languages
The data used to build these models was extracted from the C source code of what might be termed desktop applications. Will the same variable access behavior characteristics occur in source written for other application domain or in other languages?
Variables might be broadly grouped into those used to hold application values (e.g., length of something) and those used to hold housekeeping values (e.g., loop counters).
Application variables are likely to be language invariant but have some dependence on algorithm (e.g., stored in an array or linked list) or cultural coding habits (e.g., within the embedded community accessing local variables is often considered to be much less efficient than accessing global variables and there are measurably different usage patterns <book Engblom_99a><book Jones 05a> figure 288.1).
The need for housekeeping values will depend on the construct supported by a language. For instance, in C loops often involve three accesses to the loop control variable to initialise, increment and test it for (i=0; i < 10; i++); in languages that support usage of the form for (i in v_list) only one access is required; in languages with vector operations many loops are implicit.
It is possible that application and language issues will change the absolute number of accesses but not effect their distribution. More measurements are needed.
Wot, apply academic work in industry?
Academics often moan about industry not making use of their work (or at least they do within the code analysis niche I frequent, I have no real knowledge of other niches). There are three reasons for this state of affairs:
- The work that most academics do has no practical relevance to industry. This is the lion’s share of the reason and something that many academics will agree with if none of their colleges are likely to overhear them. I suspect many academics are not too fussed that their work is not used by industry and are happy to continue working on things they find interesting (or that they can write papers about that disconnected souls are happy to see published).
- Very very few people in the software industry ever read academic papers. But hey, not reading manuals is regarded as a badge of honour. Some people do read manuals and are quickly elevated to expert status. Academic papers do have a very low signal to noise ratio and learning to speed read them to locate the gold nuggets takes practice.
- If an academic’s work is applied by some company the last thing those involved will do is say anything about it. Industry is a cut-throat place and what is to be gained by freely giving useful information to the competition?
The second product my company ever produced was a range of code generators for an intermediate code that was currently interpreted; how best to match the patterns in the intermediate code and also reuse as much as possible for the different cpu targets? I found a solution in Mahadevan Ganapahi’s PhD thesis and now 33 years after publishing it he gets some credit for a long gone industrial application.
Dead trees have been replaced by a paywall
Every now and again I see a reference to that looks like an interesting paper that was published before the Internet age (i.e., pre last 90’s and not available for free download). I keep a list of such references and when I am near a university with a good library I stop off to look them up; unless there is an urgent need this is very much a background task and before last week my last such visit was over three years ago.
Last week I dropped by Reading University, where I sourced much of the non-Internet available papers for my last book. The picture below illustrates what I found, periodicals are being removed to make way for desktop space, so students can sit typing away on keyboards.
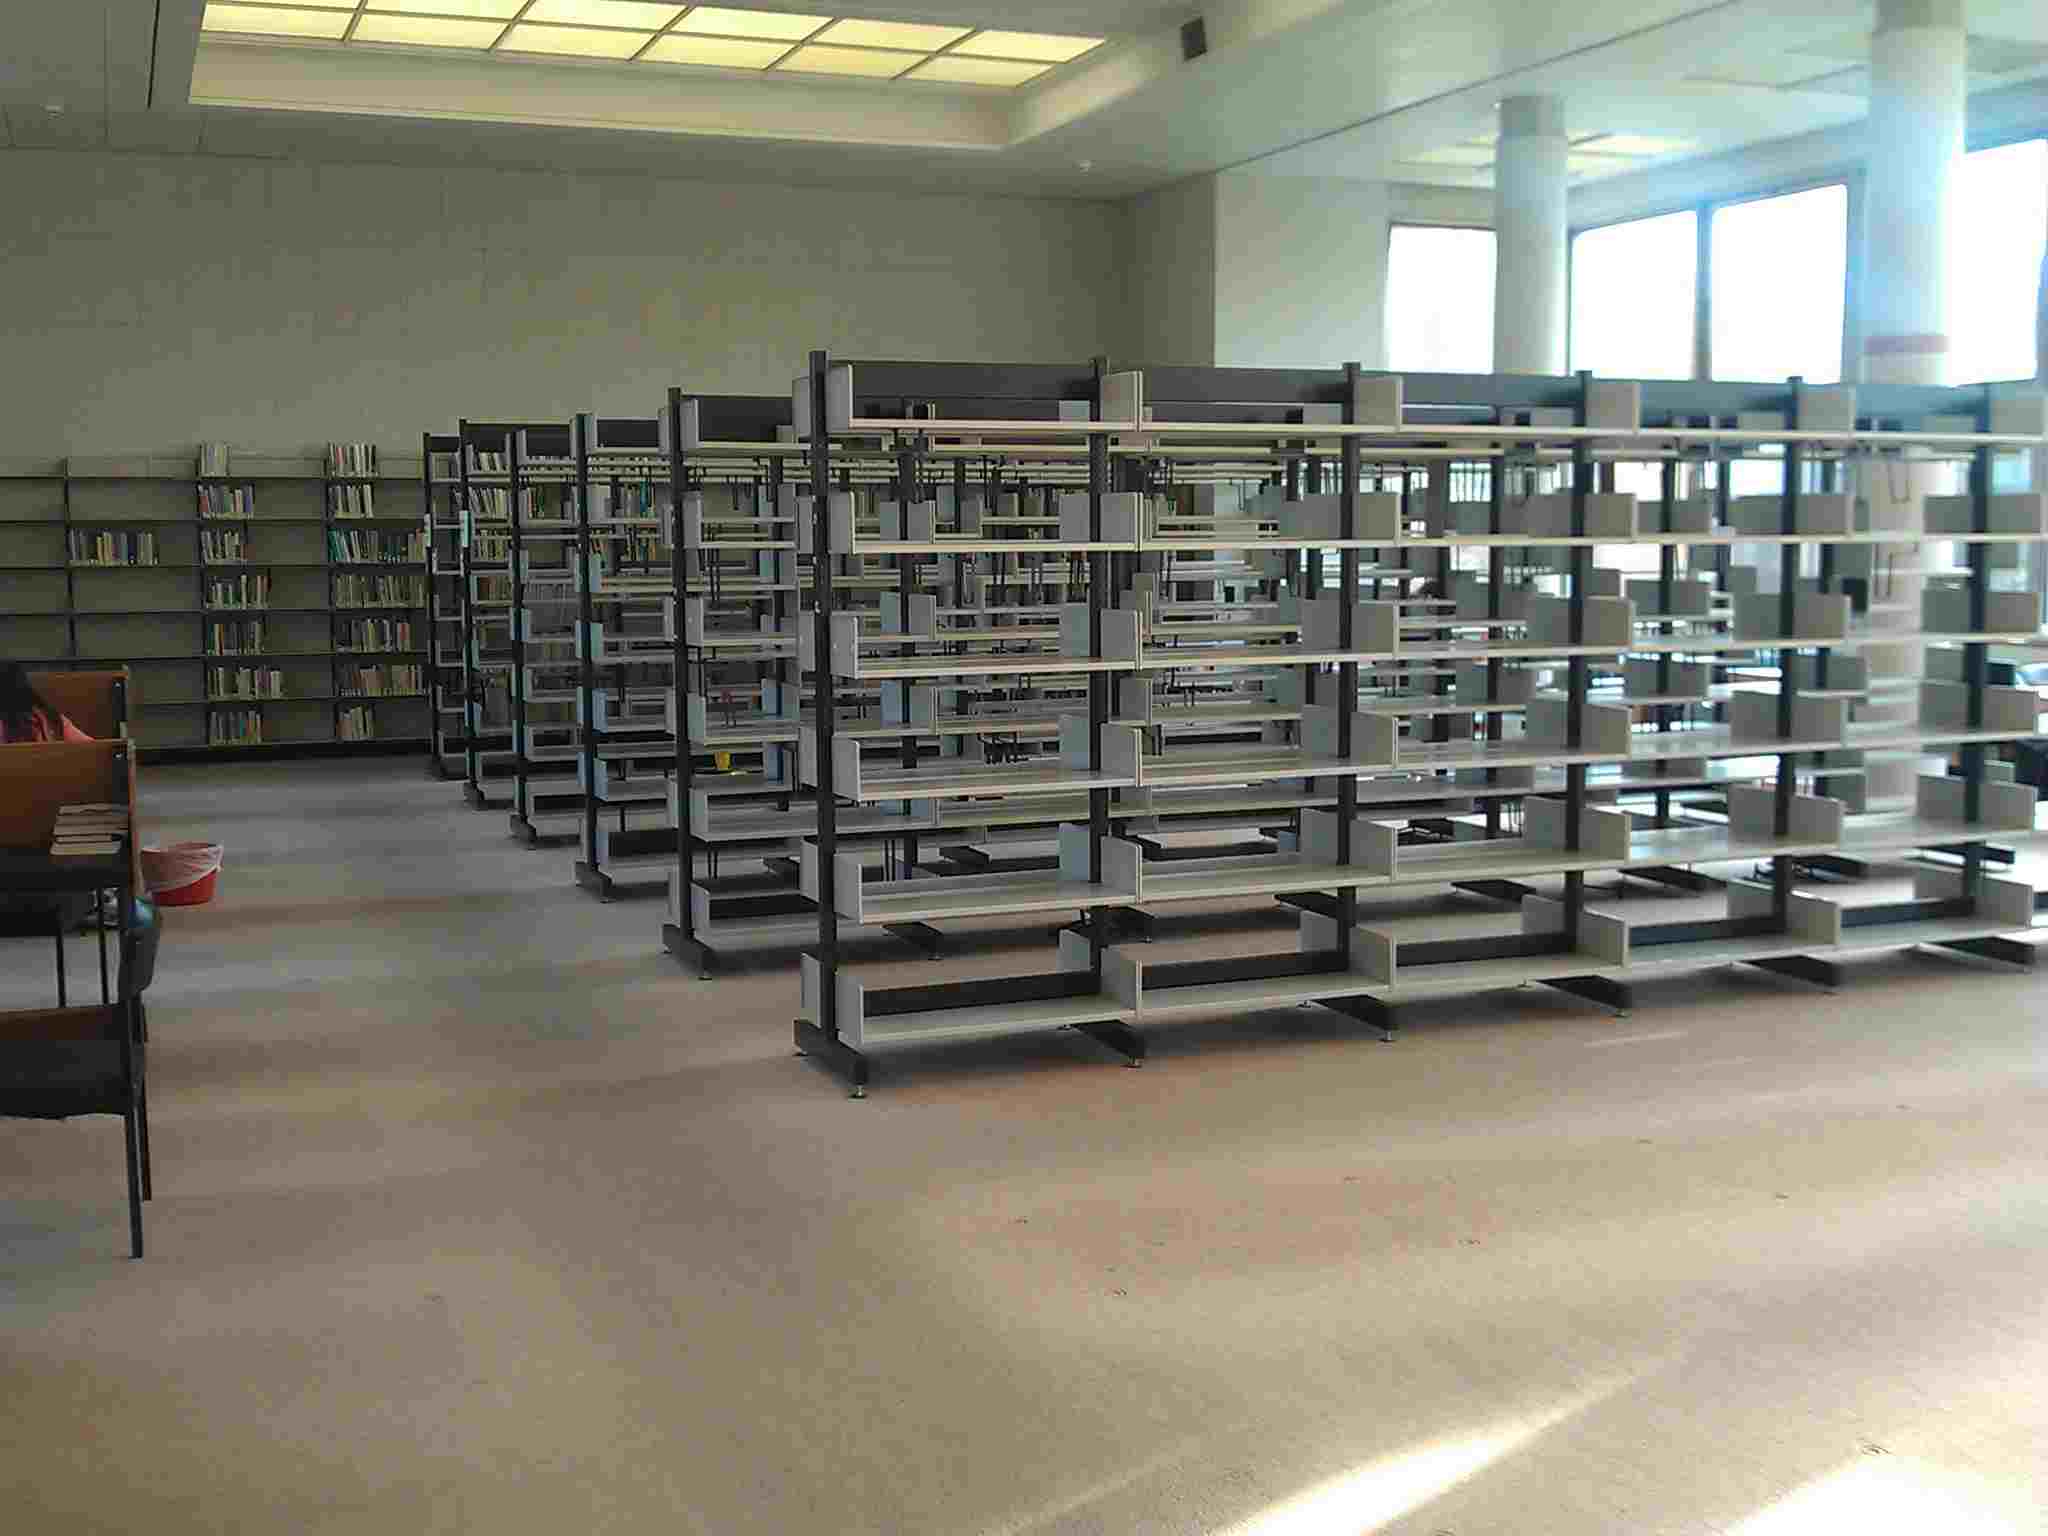
I imagine the librarian is under pressure to maximise the efficient use of his large building and having row upon row of journals, many older than most of the students, just sitting there waiting for somebody like me wanting to look at perhaps a dozen or so of them cannot be said to be that efficient.
Everything is going digital, the library catalog was full of references to where journals could be found online. The problem is that the digital content is licensed to the University and only available to members of the University (e.g., students and lecturers). Without a logon id the journals are unavailable to non-academic users. Reading are continuing their open policy to external users by offering guest accounts (“where licence conditions permit”, I will find out what is available on my next visit).
Those readers who don’t have much interaction with the academic world may not be aware of the very high rates many publishers charge for access to published papers (that are provided to them free by academics) or the large profits made by these publishers.
Academics are starting to react against the high cost of journal subscription; I’m please to see that a boycott is gathering steam.
Boycotts are very well meaning, but I suspect that most academics will continue to keep their head down and go with existing practice (young academics need to get papers published in established to move up in their world).
We the tax payers are funding the research that discovers the information needed to write a paper and paying the salaries of academics to write the papers. Why are we the tax payers providing money to university libraries to subscribe to journals whose contents we have paid to create? If the research is tax payer funded we should not have to pay to see the results.
How do we remove the paywall that currently surrounds much published research? As I see it the simplest solution is to stop providing the funding that university libraries use to pay for journal subscriptions. Yes this will cause disruption, but the incentives are for most academics to continue with the current system and or course no company is ever willing to give up on a cash cow.
What can you do? If you are in the UK you can write to your MP to make him/her aware of your views. If readers have any other ideas please make use of the comments to tell others.
Prioritizing project stakeholders using social network metrics
Identifying project stakeholders and their requirements is a very important factor in the success of any project. Existing techniques tend to be very ad-hoc. In her PhD thesis Soo Ling Lim came up with a very interesting solution using social network analysis and what is more made her raw data available for download 🙂
I have analysed some of Soo Ling’s data below as another draft section from my book Empirical software engineering with R. As always comments and pointers to more data welcome. R code and data here.
A more detailed discussion and analysis is available in Soo Ling Lim’s thesis, which is very readable. Thanks to Soo Ling for answering my questions about her work.
Stakeholder roles and individuals
A stakeholder is a person who has an interest in what an application does. In a well organised development project the influential stakeholders are consulted before any contracts or budgets are agreed. Failure to identify the important stakeholders can result in missing or poorly prioritized requirements which can have a significant impact on the successful outcome of a project.
While many people might consider themselves to be stakeholders whose opinions should be considered, in practice the following groups are the most likely to have their opinions taken into account:
- people having an influence on project funding,
- customers, i.e., those people who are willing pay to use or obtain a copy of the application,
- domain experts, i.e., people with experience in the subject area who might suggest better ways to do something or problems to try and avoid,
- people who have influence over the success or failure over the actual implementation effort, e.g., software developers and business policy makers,
- end-users of the application (who on large projects are often far removed from those paying for it).
In the case of volunteer open source projects the only people having any influence are those willing to do the work. On open source projects made up of paid contributors and volunteers the situation is likely to be complicated.
Individuals have influence via the roles they have within the domain addressed by an application. For instance, the specification of a security card access system is of interest to the role of ‘being in charge of the library’ because the person holding that role needs to control access to various facilities provided within different parts of the library, while the role of ‘student representative’ might be interested in the privacy aspects of the information held by the application and the role of ‘criminal’ has an interest in how easy it is to circumvent the access control measures.
If an application is used by large numbers of people there are likely to be many stakeholders and roles, identifying all these and prioritizing them has, from experience, been found to be time consuming and difficult. Once stakeholders have been identified they then need to be persuaded to invest time learning about the proposed application and to provide their own views.
The RALIC study
A study by Lim <book Lim_10> was based on a University College London (UCL) project to combine different access control mechanisms into one, such as access to the library and fitness centre. The Replacement Access, Library and ID Card (RALIC) project had more than 60 stakeholders and 30,000 users, and has been deployed at UCL since 2007, two years before the study started. Lim created the StakeNet project with the aim of to identifying and prioritising stakeholders.
Because the RALIC project had been completed Lim had access to complete project documentation from start to finish. This documentation, along with interviews of those involved, were used to create what Lim called the Ground truth of project stakeholder role priority, stakeholder identification (85 people) and their rank within a role, requirements and their relative priorities; to quote Lim ‘The ground truth is the complete and prioritised list of stakeholders and requirements for the project obtained by analysing the stakeholders and requirements from the start of the project until after the system is deployed.’
The term salience is used to denote the level of a stakeholder’s influence.
Data
The data consists of three stakeholder related lists created as follows (all names have been made anonymous):
- the Ground truth list: derived from existing RALIC documentation. The following is an extract from this list (individual are ranked within each stakeholder role):
Role Rank,      Stakeholder Role,       Stakeholder Rank,       Stakeholder
1,      Security and Access Systems,    1,              Mike Dawson
1,      Security and Access Systems,    2,              Jason Ortiz
1,      Security and Access Systems,    3,              Nick Kyle
1,      Security and Access Systems,    4,              Paul Haywood
2,      Estates and Facilities Division,1,              Richard Fuller
- the Open list: starting from an initial list of 22 names and 28 stakeholder roles, four iterations of [Snowball sampling] resulted in a total of 61 responses containing 127 stakeholder names+priorities and 70 stakeholder roles,
- the Closed list: a list of 50 possible stakeholders was created from the RALIC project documentation plus names of other UCL staff added as noise. The people on this list were asked to indicated which of those names on the list they considered to be stakeholders and to assign them a salience between 1 and 10, they were also given the option to suggest names of possible stakeholders. This process generated a list containing 76 stakeholders names+priorities and 39 stakeholder roles.
The following is an extract from the last two stakeholder lists:
stakeholder stakeholder role salience David Ainsley Ian More 1 David Ainsley Rachna Kaplan 6 David Ainsley Kathleen Niche 4 David Ainsley Art Waller 1 David Carne Mark Wesley 4 David Carne Lis Hands 4 David Carne Vincent Matthew 4 Keith Lyon Michael Wondor 1 Keith Lyon Marilyn Gallo 1 Kerstin Michel Greg Beech 1 Kerstin Michel Mike Dawson 6 |
Is the data believable?
The data was gathered after the project was completed and as such it is likely to contain some degree of hindsight bias.
The data cleaning process is described in detail by Lim and looks to be thorough.
Predictions made in advance
Lim drew a parallel between the stakeholder prioritisation problem and the various techniques used to rank the nodes in social network analysis, e.g., the Page Rank algorithm. The hypothesis is that there is a strong correlation exists between the rank ordering of stakeholder roles in the Grounded truth list and the rank of stakeholder roles calculated using various social network metrics.
Applicable techniques
How might a list of people and the salience they assign to other people be converted to a single salience for each person? Lim proposed that social network metrics be used. A variety of techniques for calculating social network node centrality metrics have been proposed and some of these, including most used by Lim, are calculated in the following analysis.
Lim compared the Grounded truth ranking of stakeholder roles against the stakeholder role ranking created using the following network metrics:
- betweenness centrality: for a given node it is a count of the number of shortest paths from all nodes in a graph to all other nodes in that graph that pass through the given node; the value is sometimes normalised,
- closeness centrality: for a given node closeness is the inverse of farness, which is the sum of that node’s distances to all other nodes in the graph; the value is sometimes normalised,
- degree centrality: in-degree centrality is a count of the number of edges referring to a node, out-degree centrality is the number of edges that a node refers to; the value is sometimes normalised,
- load centrality: this is a variant of betweenness centrality based on the fraction of shortest paths through a given node. Support for load centrality is not available in the
igraphpackage and so is not used here, this functionality is available in thestatnetpackage, - pagerank: the famous algorithm proposed by Page and Brin <book Page_98> for ranking web pages.
Eigenvector centrality is another commonly used network metric and is included in this analysis.
Results
The igraph package includes functions for computing many of the common social network metrics. Reading data and generating a graph (the mathematical term for a social network) from it is particularly easy, in this case the graph.data.frame function is used to create a representation of its graph from the contents of a file read by read.csv.
The figure below plots Pagerank values for each node in the network created from the Open and Closed stakeholder salience ratings (Pagerank was chosen for this example because it had one of the strongest correlations with the Ground truth ranking). There is an obvious difference in the shape of the curves: the Open saliences (green) is fitted by the equation  (black line), while the Closed saliences (blue) is piecewise fitted by
  and
and  (red lines).
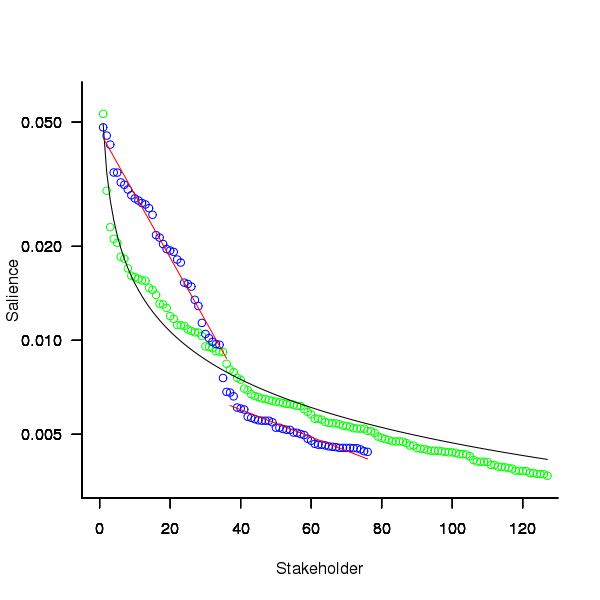
Figure 1. Plot of Pagerank of the stakeholder nodes in the network created from the Open (green) and Closed (blue) stakeholder responses (values for each have been sorted). See text for details of fitted curves.
To compare the ability of network centrality metrics to produce usable orderings of stakeholder roles a comparison has to be made against the Ground truth. The information in the Ground truth is a ranked list of stakeholder roles, not numeric values. The Stakeholder/centrality metric pairs need to be mapped to a ranked list of stakeholder roles. This mapping is achieved by associating a stakeholder role with each stakeholder name (this association was collected by Lim during the interview process), sorting stakeholder role/names by decreasing centrality metric and then ranking roles based on their first occurrence in the sorted list (see rexample[stakeholder]).
The Ground truth contains stakeholder roles not filled by any of the stakeholders in the Open or Closed data set, and vice versa. Before calculating role ranking correlation by roles not in both lists were removed.
The table below lists the Pearson correlation between the Ground truth ranking of stakeholder roles and for the ranking produced from calculating various network metrics from the Closed and Open stakeholder salience questionnaire data (when applied to ranks the Pearson correlation coefficient is equivalent to the Spearman rank correlation coefficient).
| betweenness | closeness | degree in | degree out | eigenvector | pagerank | |
|---|---|---|---|---|---|---|
|
Open
|
0.63
|
0.46
|
0.54
|
0.52
|
0.62
|
0.60
|
|
Weighted Open
|
0.66
|
0.49
|
0.62
|
0.50
|
0.68
|
0.67
|
|
Closed
|
0.51
|
0.53
|
0.67
|
0.60
|
0.69
|
0.71
|
|
Weighted Closed
|
0.50
|
0.50
|
0.63
|
0.54
|
0.68
|
0.72
|
The Open/Closed correlation calculation is based on a linear ranking. However, plotting Stakeholder salience, as in the plot above, shows a nonlinear distribution, with the some stakeholders having a lot more salience than less others. A correlation coefficient calculated by weighting the rankings may be more realistic. The “weighted” rows in the above are the correlations calculated using a weight based on the equations fitted in the Pagerank plot above; there is not a lot of difference.
Discussion
Network metrics are very new and applications making use of them still do so via a process of trial and error. For instance, the Pagerank algorithm was found to provide a good starting point for ranking web pages and many refinements have subsequently been added to the web ranking algorithms used by search engines.
When attempting to assign a priority to stakeholder roles and the people that fill them various network metric provide different ways of interpreting information about relationships between stakeholders. Lim’s work has shown that some network metrics can be used to produce ranks similar to those actually used (at least for one project).
One major factor not included in the above analysis is the financial contribution that each stakeholder role makes towards the implementation cost. Presumably those roles contributing a large percentage will want to be treated as having a higher priority than those contributing a smaller percentage.
The social network metrics calculated for stakeholder roles were only used to generate a ranking so that a comparison could be made against the ranked list available in the Ground truth. A rank ordering is a linear relationship between stakeholders; in real life differences in priority given to roles and stakeholders may not be linear. Perhaps the actual calculated network metric values are a better (often nonlinear) measure of relative difference, only experience will tell.
Summary of findings
Building a successful application is a very hard problem and being successful at it is something of a black art. There is nothing to say that a different Ground truth stakeholder role ranking would have lead to the RALIC project being just as successful. The relatively good correlation between the Ground truth ranking and the ranking created using some of the network metrics provides some confidence that these metrics might be of practical use.
Given that information on stakeholders’ rating of other stakeholders can be obtained relatively cheaply (Lim built a web site to collect this kind of information <book Lim_11>), for any large project a social network analysis appears to be a cost effect way of gathering and organizing information.
Spreadsheet errors: open source or survival of the fittest
There is a bit of a kerfuffle going on in the economics world at the moment over spreadsheet errors and data cherry-picking in an influential paper about the current economic crisis. I don’t know anything about economics and will leave commentary on the data cherry-picking to others, but I can claim to know something about coding errors.
Stories of companies loosing lots of money because of small mistakes in a spreadsheet are fairly common, this problem is not rare or unimportant. Academic research on spreadsheets seems to be slowly gathering steam, with PhDs appearing every now and again. Industry appears to be more active, with a variety of companies offering tools aimed at finding faults in spreadsheets.
Based on my somewhat limited experience of helping people fix spreadsheet problems, I suspect that no amount of research or tool availability from industry will solve the real problem that faces spreadsheet users, which is that they don’t appreciate their own fallibility.
Back when software development first started, people were very surprised to discover the existence of software faults. As every new programmer discovers, computers are merciless and will punish the slightest coding mistake. A large part of becoming a professional developer involves learning how to structure development to deal with personal fallibility, plus developing a mental attitude capable of handling the constant reminder of personal fallibility that computers provide to anybody writing code to tell them what to do (something that deters some people from becoming developers).
It rarely enters the head’s of people who are sporadic authors of code or spreadsheets that they may be making subtle mistakes that can have a significant impact on the results produced. Getting somebody with this frame of mind to perform testing on what they have written is well-nigh on impossible.
In a research context one very practical solution to the code reliability issue is to insist that code or/and spreadsheets be made freely available. Only when the spreadsheet used to create the results in the paper linked to above was made available to others were the mistakes it contained uncovered.
In a commercial context it is down to survival of the fittest, those companies who do not keep their spreadsheet errors below a recoverable level die.
Recent Comments