Archive
Relative performance of computers since the 1990s
What was the range of performance of desktop’ish computers introduced since the 1990s, and what was the annual rate of performance increase (answers for earlier computers)?
Microcomputers based on Intel’s x86 family was decimating most non-niche cpu families by the early 1990s. During this cpu transition a shift to a new benchmark suite followed a few years behind. The SPEC cpu benchmark originated in 1989, followed by a 1992 update, with the 1995 update becoming widely used. Pre-1995 results don’t appear on the SPEC website: “Because SPEC’s processes were paper-based and not electronic back when SPEC CPU 92 was the current benchmark, SPEC does not have any electronic storage of these benchmark results.” Thanks to various groups, some SPEC89/92 results are still available.
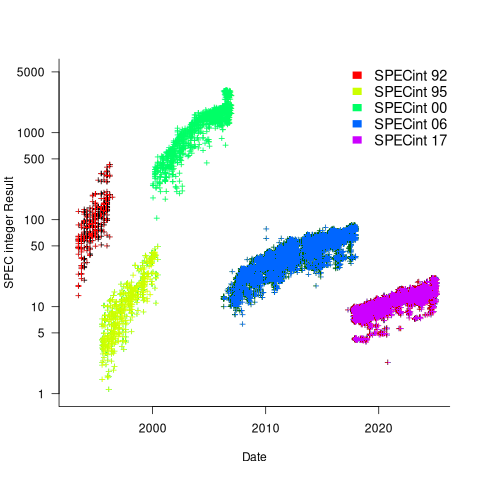
The following analysis uses the results from the SPEC integer benchmarks, which was changed in 1992, 1995, 2000, 2008, and 2017.
Every time a benchmark is changed, the reported results for the same computer change, perhaps by a lot. The plot below shows the results for each version of the benchmark (code+data):
Provide a few conditions are met, it is possible to normalise each set of results, allowing comparisons to be made across benchmark changes. First, results from running, say, both SPEC92 and SPEC95 on some set of computer needs to be available. These paired results can be used to build a model that maps result values from one benchmark to the other. The accuracy of the mapping will depend on there being a consistent pattern of change, i.e., a strong correlation between benchmark results.
The plot below shows the normalised results, along with regression models fitted to each release (code+data):
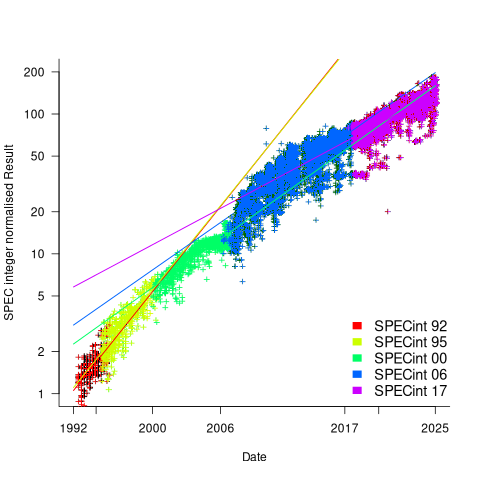
What happened around 2007? Dennard scaling stopped, and there is an obvious meeting of two curves as one epoch transitioned into another. Since 2007 performance improvements have been driven by faster memory, larger caches, and for some applications multiple on-die cpus.
The table below shows the annual growth in SPECint performance for each of the benchmark start years, over their lifetime.
      Year   Annual growth
      1992       26.2%
      1995       25.9%
      2000       14.2%
      2007       13.9%
2017 10.5% |
In 2025, the cpu integer performance of the average desktop system is over 100 times faster than the average 1992 desktop system. With the first factor of 10 improvement in the first 10 years, and the second factor of 10 in the previous 20 years.
Recent Comments