Evaluating Story point estimation error
If a task implementation estimate is expressed in time, various formula are available for evaluating how well the estimated time corresponds to the actual time.
When an estimate is expressed in story points, how might the estimate be evaluated when actual time is measured in hours?
The common practice of selecting story point values from a small set of integers (I have seen fractional values used) introduces quantization error into most estimates (around 30% of time estimates equal actual time), assuming that actual times are not constrained to a similar number of possible time values.
If we assume a linear mapping from estimated story points to actual time and an ideal estimator (let’s assume that 1 story point is equivalent to 1 hour), then a lower bound on the error can be calculated.
Our ideal estimator is able to exactly predict the actual time. However, the use of story points means that this exact prediction has to be rounded to one of a small set of integer values. Let’s assume that our ideal estimator rounds to the story point value that is closest to the exact prediction, e.g., all story points predicted to take up to 1.5 are estimated at 1 story point.
What is the mean error of the estimates made by this ideal, rounded, estimator?
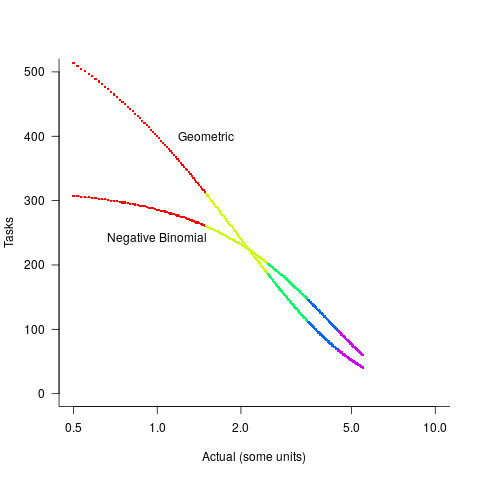
The available evidence shows that the distribution of tasks having a given actual implementation time roughly has the form of a geometric (the discrete form of exponential) or negative binomial distribution. The plot below shows a geometric and negative binomial distribution, with distinct colors over the range where values are rounded to the same closest integer (dots are at 1-minute intervals, code):
Having picked a distribution for actual times, we can calculate the number of tasks estimated to require, for instance, 1 story point, but actually taking 1 hour, 1 hr 1 min, 1 hr 2 min, …, 1 hr 30 min. The mean error can be calculated over each pair of estimate/actual, for one to five story points (in this example). The table below lists the mean error for two actual distributions, calculated using four common metrics: squared error (SE), absolute error (AE), absolute percentage error (APE), and relative error (RE); code:
Distribution SE AE APE RE Geometric 0.087 0.26 0.17 0.20 Negative Binomial 0.086 0.25 0.14 0.16 |
A few minutes difference in a 1 SP estimate is a larger error than the same number of minutes in a two or more SP estimate, combined with most tasks take a small amount of time, means that error estimation is dominated by inaccuracies in estimating small tasks.
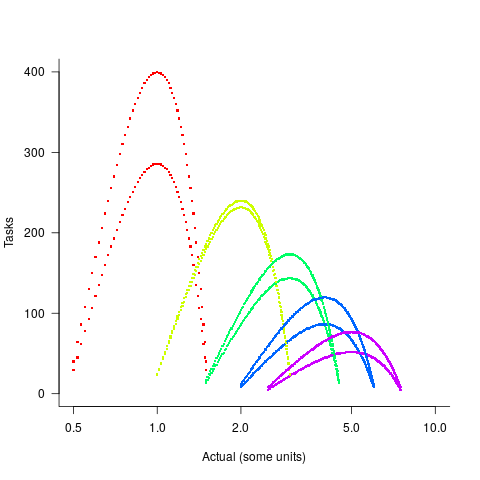
In practice, the range of actual times, for a given estimate, is better approximated by a percentage of the estimated time (50% is used below), and the number of tasks having a given actual value for a given estimate, approximated by a triangular distribution (a cubic equation was used for the following calculation). The plot below shows the distribution of estimation points around a given number of story points (at 1-minute intervals), and the geometric and negative binomial distribution (compare against plot above to work out which is which; code):
The following table lists of mean errors:
Distribution SE AE APE RE Geometric 0.52 0.55 0.13 0.13 Negative Binomial 0.62 0.61 0.13 0.14 |
When the error in the actual is a percentage of the estimate, larger estimates have a much larger impact on absolute accuracy; see the much larger SE and AE values. The impact on the relative accuracy metrics appears to be small.
Is evaluating estimation error useful, when estimates are given in story points?
While it’s possible to argue for and against, the answer is that usefulness is in the eye of the beholder. If development teams find the information useful, then it is useful; otherwise not.
Recent Comments