Archive
4,000 vs 400 vs 40 hours of software development practice
What is the skill difference between professional developers and newly minted computer science graduates?
Practice, e.g., 4,000 vs. 400 hours
People get better with practice, and after two years (around 4,000 hours) a professional developer will have had at least an order of magnitude more practice than most students; not just more practice, but advice and feedback from experienced developers. Most of these 4,000 hours are probably not the deliberate practice of 10,000 hours fame.
It’s understandable that graduates with a computing degree consider themselves to be proficient software developers; this opinion is based on personal experience (i.e., working with other students like themselves), and not having spent time working with professional developers. It’s not a joke that a surprising number of academics don’t appreciate the student/professional difference, the problem is that some academics only ever get to see a limit range of software development expertise (it’s a question of incentives).
Surveys of student study time have found that for Computer science, around 50% of students spend 11 hours or more, per week, in taught study and another 11 hours or more doing independent learning; let’s take 11 hours per week as the mean, and 30 academic weeks in a year. How much of the 330 hours per year of independent learning time is spent creating software (that’s 1,000 hours over a three-year degree, assuming that any programming is required)? I have no idea, and picked 40% because it matched up with 4,000.
Based on my experience with recent graduates, 400 hours sounds high (I have no idea whether an average student spends 4-hours per week doing programming assignments). While a rare few are excellent, most are hopeless. Perhaps the few hours per week nature of their coding means that they are constantly relearning, or perhaps they are just cutting and pasting code from the Internet.
Most graduates start their careers working in industry (around 50% of comp sci/maths graduates work in an ICT profession; UK higher-education data), which means that those working in industry are ideally placed to compare the skills of recent graduates and professional developers. Professional developers have first-hand experience of their novice-level ability. This is not a criticism of computing degrees; there are only so many hours in a day and lots of non-programming material to teach.
Many software developers working in industry don’t have a computing related degree (I don’t). Lots of non-computing STEM degrees give students the option of learning to program (I had to learn FORTRAN, no option). I don’t have any data on the percentage of software developers with a computing related degree, and neither do I have any data on the average number of hours non-computing STEM students spend on programming; I’ve cosen 40 hours to flow with the sequence of 4’s (some non-computing STEM students spend a lot more than 400 hours programming; I certainly did). The fact that industry hires a non-trivial number of non-computing STEM graduates as software developers suggests that, for practical purposes, there is not a lot of difference between 400 and 40 hours of practice; some companies will take somebody who shows potential, but no existing coding knowledge, and teach them to program.
Many of those who apply for a job that involves software development never get past the initial screening; something like 80% of people applying for a job that specifies the ability to code, cannot code. This figure is based on various conversations I have had with people about their company’s developer recruitment experiences; it is not backed up with recorded data.
Some of the factors leading to this surprisingly high value include: people attracted by the salary deciding to apply regardless, graduates with a computing degree that did not require any programming (there is customer demand for computing degrees, and many people find programming is just too hard for them to handle, so universities offer computing degrees where programming is optional), concentration of the pool of applicants, because those that can code exit the applicant pool, leaving behind those that cannot program (who keep on applying).
Apologies to regular readers for yet another post on professional developers vs. students, but I keep getting asked about this issue.
Anthropological studies of software engineering
Anthropology is the study of humans, and as such it is the top level research domain for many of the human activities involved in software engineering. What has been discovered by the handful of anthropologists who have spent time researching the tiny percentage of humans involved in writing software?
A common ‘discovery’ is that developers don’t appear to be doing what academics in computing departments claim they do; hardly news to those working in industry.
The main subfields relevant to software are probably: cultural anthropology and social anthropology (in the US these are combined under the name sociocultural anthropology), plus linguistic anthropology (how language influences social life and shapes communication). There is also historical anthropology, which is technically what historians of computing do.
For convenience, I’m labelling anybody working in an area covered by anthropology as an anthropologist.
I don’t recommend reading any anthropology papers unless you plan to invest a lot of time in some subfield. While I have read lots of software engineering papers, anthropologist’s papers on this topic are often incomprehensible to me. These papers might best be described as anthropology speak interspersed with software related terms.
Anthropologists write books, and some of them are very readable to a more general audience.
The Art of Being Human: A Textbook for Cultural Anthropology by Wesch is a beginner’s introduction to its subject.
Ethnography, which explores cultural phenomena from the point of view of the subject of the study, is probably the most approachable anthropological research. Ethnographers spend many months living with a remote tribe, community, or nowadays a software development company, and then write-up their findings in a thesis/report/book. Examples of approachable books include: “Engineering Culture: Control and Commitment in a High-Tech Corporation” by Kunda, who studied a large high-tech company in the mid-1980s; “No-Collar: The Humane Workplace and its Hidden Costs” by Ross, who studied an internet startup that had just IPO’ed, and “Coding Freedom: The Ethics and Aesthetics of Hacking” by Coleman, who studied hacker culture.
Linguistic anthropology is the field whose researchers are mostly likely to match developers’ preconceived ideas about what humanities academics talk about. If I had been educated in an environment where Greek and nineteenth century philosophers were the reference points for any discussion, then I too would use this existing skill set in my discussions of source code (philosophers of source code did not appear until the twentieth century). Who wouldn’t want to apply hermeneutics to the interpretation of source code (the field is known as Critical code studies)?
It does not help that the software knowledge of many of the academics appears to have been acquired by reading computer books from the 1940s and 1950s.
The most approachable linguistic anthropology book I have found, for developers, is: The Philosophy of Software Code and Mediation in the Digital Age by Berry (not that I have skimmed many).
Study of developers for the cost of a phase I clinical drug trial
For many years now, I have been telling people that software researchers need to be more ambitious and apply for multi-million pound/dollar grants to run experiments in software engineering. After all, NASA spends a billion or so sending a probe to take some snaps of a planet and astronomers lobby for $100million funding for a new telescope.
What kind of experimental study might be run for a few million pounds (e.g., the cost of a Phase I clinical drug trial)?
Let’s say that each experiment involves a team of professional developers implementing a software system; call this a Project. We want the Project to be long enough to be realistic, say a week.
Different people exhibit different performance characteristics, and the experimental technique used to handle this is to have multiple teams independently implement the same software system. How many teams are needed? Fifteen ought to be enough, but more is better.
Different software systems contain different components that make implementation easier/harder for those involved. To remove single system bias, a variety of software systems need to be used as Projects. Fifteen distinct Projects would be great, but perhaps we can get away with five.
How many developers are on a team? Agile task estimation data shows that most teams are small, i.e., mostly single person, with two and three people teams making up almost all the rest.
If we have five teams of one person, five of two people, and five of three people, then there are 15 teams and 30 people.
How many people will be needed over all Projects?
15 teams (30 people) each implementing one Project 5 Projects, which will require 5*30=150 people (5*15=75 teams) |
How many person days are likely to be needed?
If a 3-person team takes a week (5 days), a 2-person team will take perhaps 7-8 days. A 1-person team might take 9-10 days.
The 15 teams will consume 5*3*5+5*2*7+5*1*9=190 person days The 5 Projects will consume 5*190=950 person days |
How much is this likely to cost?
The current average daily rate for a contractor in the UK is around £500, giving an expected cost of 190*500=£475,000 to hire the experimental subjects. Venue hire is around £40K (we want members of each team to be co-located).
The above analysis involves subjects implementing one Project. If, say, each subject implements two, three or four Projects, one after the other, the cost is around £2million, i.e., the cost of a Phase I clinical drug trial.
What might we learn from having subjects implement multiple Projects?
Team performance depends on the knowledge and skill of its members, and their ability to work together. Data from these experiments would be the first of their kind, and would provide realistic guidance on performance factors such as: impact of team size; impact of practice; impact of prior experience working together; impact of existing Project experience. The multiple implementations of the same Project created provide a foundation for measuring expected reliability and theories of N-version programming.
A team of 1 developer will take longer to implement a Project than a team of 2, who will take longer than a team of 3.
If 20 working days is taken as the ballpark period over which a group of subjects are hired (i.e., a month), there are six team size sequences that one subject could work (A to F below); where individual elapsed time is close to 20 days (team size 1 is 10 days elapsed, team size 2 is 7.5 days, team size 3 is 5 days).
Team size    A      B      C      D      E      F
    1      twice   once   once
    2                     once  thrice  once
3 twice twice four |
The cost of hiring subjects+venue+equipment+support for such a study is likely to be at least £1,900,000.
If the cost of beta testing, venue hire and research assistants (needed during experimental runs) is included, the cost is close to £2.75 million.
Might it be cheaper and simpler to hire, say, 20-30 staff from a medium size development company? I chose a medium-sized company because we would be able to exert some influence over developer selection and keeping the same developers involved. The profit from 20-30 people for a month is not enough to create much influence within a large company, and a small company would not want to dedicate a large percentage of its staff for a solid month.
Beta testing is needed to validate both the specifications for each Project and that it is possible to schedule individuals to work in a sequence of teams over a month (individual variations in performance create a scheduling nightmare).
Growth in FLOPs used to train ML models
AI (a.k.a. machine learning) is a compute intensive activity, with the performance of trained models being dependent on the quantity of compute used to train the model.
Given the ongoing history of continually increasing compute power, what is the maximum compute power that might be available to train ML models in the coming years?
How might the compute resources used to train an ML model be measured?
One obvious answer is to specify the computers used and the numbers of days used they were occupied training the model. The problem with this approach is that the differences between the computers used can be substantial. How is compute power measured in other domains?
Supercomputers are ranked using FLOPS (floating-point operations per second), or GigFLOPS or PetaFLOPS ( ). The Top500 list gives values for
  (based on benchmark performance, i.e., LINNPACK) and
  (what the hardware is theoretically capable of, which is sometimes more than twice ).
A ballpark approach to measuring the FLOPs consumed by an application is to estimate the FLOPS consumed by the computers involved and multiply by the number of seconds each computer was involved in training. The huge assumption made with this calculation is that the application actually consumes all the FLOPS that the hardware is capable of supplying. In some cases this appears to be the metric used to estimate the compute resources used to train an ML model. Some published papers just list a FLOPs value, while others list the number of GPUs used (e.g., 2,128).
A few papers attempt a more refined approach. For instance, the paper describing the GPT-3 models derives its FLOPs values from quantities such as the number of parameters in each model and number of training tokens used. Presumably, the research group built a calibration model that provided the information needed to estimate FLOPS in this way.
How does one get to be able to use PetaFLOPS of compute to train a model (training the GPT-3 175B model consumed 3,640 PetaFLOP days, or around a few days on a top 8 supercomputer)?
Pay what it costs. Money buys cloud compute or bespoke supercomputers (which are more cost-effective for large scale tasks, if you have around £100million to spend plus £10million or so for the annual electricity bill). While the amount paid to train a model might have lots of practical value (e.g., can I afford to train such a model), researchers might not be keen to let everybody know how much they spent. For instance, if a research team have a deal with a major cloud provider to soak up any unused capacity, those involved probably have no interest in calculating compute cost.
How has the compute power used to train ML models increased over time? A recent paper includes data on the training of 493 models, of which 129 include estimated FLOPs, and 106 contain date and model parameter data. The data comes from published papers, and there are many thousands of papers that train ML models. The authors used various notability criteria to select papers, and my take on the selection is that it represents the high-end of compute resources used over time (which is what I’m interested in). While they did a great job of extracting data, there is no real analysis (apart from fitting equations).
The plot below shows the FLOPs training budget used/claimed/estimated for ML models described in papers published on given dates; lines are fitted regression models, and the colors are explained below (code+data):
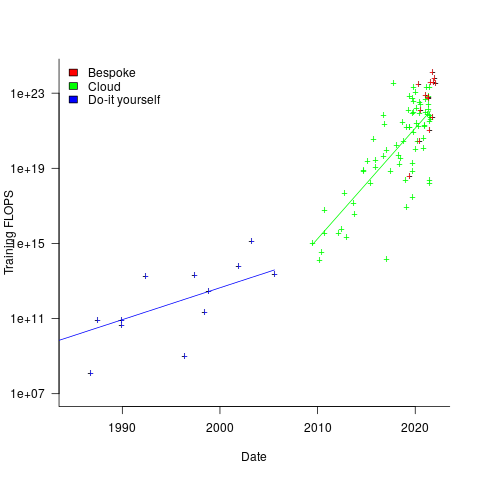
My interpretation of the data is based on the economics of accessing compute resources. I see three periods of development:
- do-it yourself (18 data points): During this period most model builders only had access to a university computer, desktop machines, or a compute cluster they had self-built,
- cloud (74 data points): Huge on demand compute resources are now just a credit card away. Researchers no longer have to wait for congested university computers to become available, or build their own systems.
AWS launched in 2006, and the above plot shows a distinct increase in compute resources around 2008.
- bespoke (14 data points): if the ML training budget is large enough, it becomes cost-effective to build a bespoke system, e.g., a supercomputer. As well as being more cost-effective, a bespoke system can also be specifically designed to handle the characteristics of the kinds of applications run.
How might models trained using a bespoke system be distinguished from those trained using cloud compute? The plot below shows the number of parameters in each trained model, over time, and there is a distinct gap between
 and
and  parameters, which I assume is the result of bespoke systems having the memory capacity to handle more parameters (code+data):
The rise in FLOPs growth rate during the Cloud period comes from several sources: 1) the exponential decline in the prices charged by providers delivers researchers an exponentially increasing compute for the same price, 2) researchers obtaining larger grants to work on what is considered to be an important topic, 3) researchers doing deals with providers to make use of excess capacity.
The rate of growth of Cloud usage is capped by the cost of building a bespoke system. The future growth of Cloud training FLOPs will be constrained by the rate at which the prices charged for a FLOP decreases (grants are unlikely to continually increase substantially).
The rate of growth of the Top500 list is probably a good indicator of the rate of growth of bespoke system performance (and this does appear to be slowing down). Perhaps specialist ML training chips will provide performance that exceeds that of the GPU chips currently being used.
The maximum compute that can be used by an application is set by the reliability of the hardware and the percentage of resources used to recover from hard errors that occur during a calculation. Supercomputer users have been facing the possibility of hitting the wall of maximum compute for over a decade. ML training is still a minnow in the supercomputer world, where calculations run for months, rather than a few days.
Cost-effectiveness decision for fixing a known coding mistake
If a mistake is spotted in the source code of a shipping software system, is it more cost-effective to fix the mistake, or to wait for a customer to report a fault whose root cause turns out to be that particular coding mistake?
The naive answer is don’t wait for a customer fault report, based on the following simplistic argument:  .
.
where:  is the cost of fixing the mistake in the code (including testing etc), and
  is the cost of finding the mistake in the code based on a customer fault report (i.e., the sum on the right is the total cost of fixing a fault reported by a customer).
If the mistake is spotted in the code for ‘free’, then  , e.g., a developer reading the code for another reason, or flagged by a static analysis tool.
This answer is naive because it fails to take into account the possibility that the code containing the mistake is deleted/modified before any customers experience a fault caused by the mistake; let  be the likelihood that the coding mistake ceases to exist in the next unit of time.
The more often the software is used, the more likely a fault experience based on the coding mistake occurs; let  be the likelihood that a fault is reported in the next time unit.
A more realistic analysis takes into account both the likelihood of the coding mistake disappearing and a corresponding fault being reported, modifying the relationship to: *{F_{experience}/M_{gone}}")
Software systems are eventually retired from service; the likelihood that the software is maintained during the next unit of time,  , is slightly less than one.
Giving the relationship: *{F_{experience}/M_{gone}}*S_{maintained}")
which simplifies to: *{F_{experience}/M_{gone}}*S_{maintained}")
What is the likely range of values for the ratio:  ?
?
I have no find/fix cost data, although detailed total time is available, i.e., find+fix time (with time probably being a good proxy for cost). My personal experience of find often taking a lot longer than fix probably suffers from survival of memorable cases; I can think of cases where the opposite was true.
The two values in the ratio  are likely to change as a system evolves, e.g., high code turnover during early releases that slows as the system matures. The value of should decrease over time, but increase with a large influx of new users.
A study by Penta, Cerulo and Aversano investigated the lifetime of coding mistakes (detected by several tools), tracking them over three years from creation to possible removal (either fixed because of a fault report, or simply a change to the code).
Of the 2,388 coding mistakes detected in code developed over 3-years, 41 were removed as reported faults and 416 disappeared through changes to the code: 
The plot below shows the survival curve for memory related coding mistakes detected in Samba, based on reported faults (red) and all other changes to the code (blue/green, code+data):
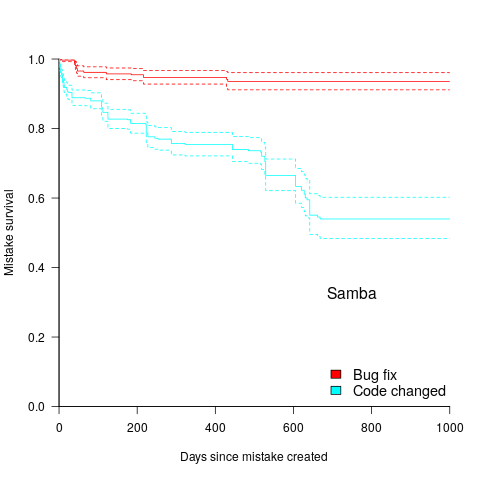
Coding mistakes are obviously being removed much more rapidly due to changes to the source, compared to customer fault reports.
For it to be cost-effective to fix coding mistakes in Samba, flagged by the tools used in this study ( is essentially one), requires:  .
.
Meeting this requirement does not look that implausible to me, but obviously data is needed.
Software engineering research is a field of dots
Software engineering research is a field of dots; people are fully focused on publishing papers about their chosen tiny little subject.
Where are the books joining the dots into even a vague outline?
Several software researchers have told me that writing books is not a worthwhile investment of their time, i.e., the number of citations they are likely to attract makes writing papers the only cost-effective medium (books containing an edited collection of papers continue to be published).
Butterfly collecting has become the method of study for many researchers. The butterflies in question often being Github repos that are collected together, based on some ‘interestingness’ metric, and then compared and contrasted in a conference paper.
The dots being collected are influenced by the problems that granting agencies consider to be important topics to fund (picking a research problem that will attract funding is a major consideration for any researcher). Fake research is one consequence of incentivizing people to use particular techniques in their research.
Whatever you think the aims of research in software engineering might be, funding the random collecting of dots does not seem like an effective strategy.
Perhaps it is just a matter of waiting for the field to grow up. Evidence-based software engineering research is still a teenager, and the novelty of butterfly collecting has yet to wear off.
My study of particular kinds of dots did not reveal many higher level patterns, although a number of folk theories were shown to be unfounded.
Estimation experiments: specification wording is mostly irrelevant
Existing software effort estimation datasets provide information about estimates made within particular development environments and with particular aims. Experiments provide a mechanism for obtaining information about estimates made under conditions of the experimenters choice, at least in theory.
Writing the code is sometimes the least time-consuming part of implementing a requirement. At hackathons, my default estimate for almost any non-trivial requirement is a couple of hours, because my implementation strategy is to find the relevant library or package and write some glue code around it. In a heavily bureaucratic organization, the coding time might be a rounding error in the time taken up by meeting, documentation and testing; so a couple of months would be considered normal.
If we concentrate on the time taken to implement the requirements in code, then estimation time and implementation time will depend on prior experience. I know that I can implement a lexer for a programming language in half-a-day, because I have done it so many times before; other people take a lot longer because they have not had the amount of practice I have had on this one task. I’m sure there are lots of tasks that would take me many days, but there is somebody who can implement them in half-a-day (because they have had lots of practice).
Given the possibility of a large variation in actual implementation times, large variations in estimates should not be surprising. Does the possibility of large variability in subject responses mean that estimation experiments have little value?
I think that estimation experiments can provide interesting information, as long as we drop the pretence that the answers given by subjects have any causal connection to the wording that appears in the task specifications they are asked to estimate.
If we assume that none of the subjects is sufficiently expert in any of the experimental tasks specified to realistically give a plausible answer, then answers must be driven by non-specification issues, e.g., the answer the client wants to hear, a value that is defensible, a round number.
A study by Lucas Gren and Richard Berntsson Svensson asked subjects to estimate the total implementation time of a list of tasks. I usually ignore software engineering experiments that use student subjects (this study eventually included professional developers), but treating the experiment as one involving social processes, rather than technical software know-how, makes subject software experience a lot less relevant.
Assume, dear reader, that you took part in this experiment, saw a list of requirements that sounded plausible, and were then asked to estimate implementation time in weeks. What estimate would you give? I would have thrown my hands up in frustration and might have answered 0.1 weeks (i.e., a few hours). I expected the most common answer to be 4 weeks (the number of weeks in a month), but it turned out to be 5 (a very ‘attractive’ round number), for student subjects (code+data).
The professional subjects appeared to be from large organizations, who I assume are used to implementations including plenty of bureaucratic stuff, as well as coding. The task specification did not include enough detailed information to create an accurate estimate, so subjects either assumed their own work environment or played along with the fresh-faced, keen experimenter (sorry Lucas). The professionals showed greater agreement in that the range of value given was not as wide as students, but it had a more uniform distribution (with maximums, rather than peaks, at 4 and 7); see below. I suspect that answers at the high end were from managers and designers with minimal coding experience.
What did the experimenters choose weeks as the unit of estimation? Perhaps they thought this expressed a reasonable implementation time (it probably is if it’s not possible to use somebody else’s library/package). I think that they could have chosen day units and gotten essentially the same results (at least for student subjects). If they had chosen hours as the estimation unit, the spread of answers would have been wider, and I’m not sure whether to bet on 7 (hours in a working day) or 10 being the most common choice.
Fitting a regression model to the student data shows estimates increasing by 0.4 weeks per year of degree progression. I was initially baffled by this, and then I realized that more experienced students expect to be given tougher problems to solve, i.e., this increase is based on self-image (code+data).
The stated hypothesis investigated by the study involved none of the above. Rather, the intent was to measure the impact of obsolete requirements on estimates. Subjects were randomly divided into three groups, with each seeing and estimating one specification. One specification contained four tasks (A), one contained five tasks (B), and one contained the same tasks as (A) plus an additional task followed by the sentence: “Please note that R5 should NOT be implemented” (C).
A regression model shows that for students and professions the estimate for (A) is about 1-2 weeks lower than (B), while (A) estimates are 3-5 weeks lower than (C) estimated.
What are subjects to make of an experimental situation where the specification includes a task that they are explicitly told to ignore?
How would you react? My first thought was that the ignore R5 sentence was itself ignored, either accidentally or on purpose. But my main thought is that Relevance theory is a complicated subject, and we are a very long way away from applying it to estimation experiments containing supposedly redundant information.
The plot below shows the number of subjects making a given estimate, in days; exp0to2 were student subjects (dashed line joins estimate that include a half-hour value, solid line whole hour), exp3 MSc students, and exp4 professional developers (code+data):
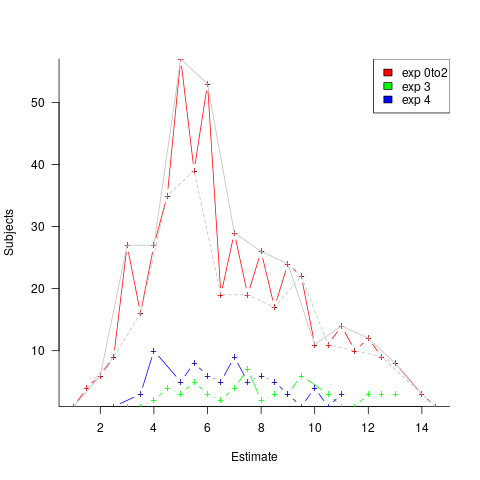
I hope that the authors of this study run more experiments, ideally working on the assumption that there is no connection between specification and estimate (apart from trivial examples).
semgrep: the future of static analysis tools
When searching for a pattern that might be present in source code contained in multiple files, what is the best tool to use?
The obvious answer is grep, and grep is great for character-based pattern searches. But patterns that are token based, or include information on language semantics, fall outside grep‘s model of pattern recognition (which does not stop people trying to cobble something together, perhaps with the help of complicated sed scripts).
Those searching source code written in C have the luxury of being able to use Coccinelle, an industrial strength C language aware pattern matching tool. It is widely used by the Linux kernel maintainers and people researching complicated source code patterns.
Over the 15+ years that Coccinelle has been available, there has been a lot of talk about supporting other languages, but nothing ever materialized.
About six months ago, I noticed semgrep and thought it interesting enough to add to my list of tool bookmarks. Then, a few days ago, I read a brief blog post that was interesting enough for me to check out other posts at that site, and this one by Yoann Padioleau really caught my attention. Yoann worked on Coccinelle, and we had an interesting email exchange some 13-years ago, when I was analyzing if-statement usage, and had subsequently worked on various static analysis tools, and was now working on semgrep. Most static analysis tools are created by somebody spending a year or so working on the implementation, making all the usual mistakes, before abandoning it to go off and do other things. High quality tools come from people with experience, who have invested lots of time learning their trade.
The documentation contains lots of examples, and working on the assumption that things would be a lot like using Coccinelle, I jumped straight in.
The pattern I choose to search for, using semgrep, involved counting the number of clauses contained in Python if-statement conditionals, e.g., the condition in: if a==1 and b==2: contains two clauses (i.e., a==1, b==2). My interest in this usage comes from ideas about if-statement nesting depth and clause complexity. The intended use case of semgrep is security researchers checking for vulnerabilities in code, but I’m sure those developing it are happy for source code researchers to use it.
As always, I first tried building the source on the Github repo, (note: the Makefile expects a git clone install, not an unzipped directory), but got fed up with having to incrementally discover and install lots of dependencies (like Coccinelle, the code is written on OCaml {93k+ lines} and Python {13k+ lines}). I joined the unwashed masses and used pip install.
The pattern rules have a yaml structure, specifying the rule name, language(s), message to output when a match is found, and the pattern to search for.
After sorting out various finger problems, writing C rather than Python, and misunderstanding the semgrep output (some of which feels like internal developer output, rather than tool user developer output), I had a set of working patterns.
The following two patterns match if-statements containing a single clause (if.subexpr-1), and two clauses (if.subexpr-2). The option commutative_boolop is set to true to allow the matching process to treat Python’s or/and as commutative, which they are not, but it reduces the number of rules that need to be written to handle all the cases when ordering of these operators is not relevant (rules+test).
rules: - id: if.subexpr-1 languages: [python] message: if-cond1 patterns: - pattern: | if $COND1: # we found an if statement $BODY - pattern-not: | if $COND2 or $COND3: # must not contain more than one condition $BODY - pattern-not: | if $COND2 and $COND3: $BODY severity: INFO - id: if.subexpr-2 languages: [python] options: commutative_boolop: true # Reduce combinatorial explosion of rules message: if-cond2 pattern-either: - patterns: - pattern: | if $COND1 or $COND2: # if statement containing two conditions $BODY - pattern-not: | if $COND3 or $COND4 or $COND5: # must not contain more than two conditions $BODY - pattern-not: | if $COND3 or $COND4 and $COND5: $BODY - patterns: - pattern: | if $COND1 and $COND2: $BODY - pattern-not: | if $COND3 and $COND4 and $COND5: $BODY - pattern-not: | if $COND3 and $COND4 or $COND5: $BODY severity: INFO |
The rules would be simpler if it were possible for a pattern to not be applied to code that earlier matched another pattern (in my example, one containing more clauses). This functionality is supported by Coccinelle, and I’m sure it will eventually appear in semgrep.
This tool has lots of rough edges, and is still rapidly evolving, I’m using version 0.82, released four days ago. What’s exciting is the support for multiple languages (ten are listed, with experimental support for twelve more, and three in beta). Roughly what happens is that source code is mapped to an abstract syntax tree that is common to all supported languages, which is then pattern matched. Supporting a new language involves writing code to perform the mapping to this common AST.
It’s not too difficult to map different languages to a common AST that contains just tokens, e.g., identifiers and their spelling, literals and their value, and keywords. Many languages use the same operator precedence and associativity as C, plus their own extras, and they tend to share the same kinds of statements; however, declarations can be very diverse, which makes life difficult for supporting a generic AST.
An awful lot of useful things can be done with a tool that is aware of expression/statement syntax and matches at the token level. More refined semantic information (e.g., a variable’s type) can be added in later versions. The extent to which an investment is made to support the various subtleties of a particular language will depend on its economic importance to those involved in supporting semgrep (Return to Corp is a VC backed company).
Outside of a few languages that have established tools doing deep semantic analysis (i.e., C and C++), semgrep has the potential to become the go-to static analysis tool for source code. It will benefit from the network effects of contributions from lots of people each working in one or more languages, taking their semgrep skills and rules from one project to another (with source code language ceasing to be a major issue). Developers using niche languages with poor or no static analysis tool support will add semgrep support for their language because it will be the lowest cost path to accessing an industrial strength tool.
How are the VC backers going to make money from funding the semgrep team? The traditional financial exit for static analysis companies is selling to a much larger company. Why would a large company buy them, when they could just fork the code (other company sales have involved closed-source tools)? Perhaps those involved think they can make money by selling services (assuming semgrep becomes the go-to tool). I have a terrible track record for making business predictions, so I will stick to the technical stuff.
Finding patterns in construction project drawing creation dates
I took part in Projecting Success‘s 13th hackathon last Thursday and Friday, at CodeNode (host to many weekend hackathons and meetups); around 200 people turned up for the first day. Team Designing-Success included Imogen, Ryan, Dillan, Mo, Zeshan (all building construction domain experts) and yours truly (a data analysis monkey who knows nothing about construction).
One of the challenges came with lots of real multi-million pound building construction project data (two csv files containing 60K+ rows and one containing 15K+ rows), provided by SISK. The data contained information on project construction drawings and RFIs (request for information) from 97 projects.
The construction industry is years ahead of the software industry in terms of collecting data, in that lots of companies actually collect data (for some, accumulate might be a better description) rather than not collecting/accumulating data. While they have data, they don’t seem to be making good use of it (so I am told).
Nearly all the discussions I have had with domain experts about the patterns found in their data have been iterative, brief email exchanges, sometimes running over many months. In this hack, everybody involved is sitting around the same table for two days, i.e., the conversation is happening in real-time and there is a cut-off time for delivery of results.
I got the impression that my fellow team-mates were new to this kind of data analysis, which is my usual experience when discussing patterns recently found in data. My standard approach is to start highlighting visual patterns present in the data (e.g., plot foo against bar), and hope that somebody says “That’s interesting” or suggests potentially more interesting items to plot.
After several dead-end iterations (i.e., plots that failed to invoke a “that’s interesting” response), drawings created per day against project duration (as a percentage of known duration) turned out to be of great interest to the domain experts.
Building construction uses a waterfall process; all the drawings (i.e., a kind of detailed requirements) are supposed to be created at the beginning of the project.
Hmm, many individual project drawing plots were showing quite a few drawings being created close to the end of the project. How could this be? It turns out that there are lots of different reasons for creating a drawing (74 reasons in the data), and that it is to be expected that some kinds of drawings are likely to be created late in the day, e.g., specific landscaping details. The 74 reasons were mapped to three drawing categories (As built, Construction, and Design Development), then project drawings were recounted and plotted in three colors (see below).
The domain experts (i.e., everybody except me) enjoyed themselves interpreting these plots. I nodded sagely, and occasionally blew my cover by asking about an acronym that everybody in the construction obviously knew.
The project meta-data includes a measure of project performance (a value between one and five, derived from profitability and other confidential values) and type of business contract (a value between one and four). The data from the 97 projects was combined by performance and contract to give 20 aggregated plots. The evolution of the number of drawings created per day might vary by contract, and the hypothesis was that projects at different performance levels would exhibit undesirable patterns in the evolution of the number of drawings created.
The plots below contain patterns in the quantity of drawings created by percentage of project completion, that are: (left) considered a good project for contract type 1 (level 5 are best performing projects), and (right) considered a bad project for contract type 1 (level 1 is the worst performing project). Contact the domain experts for details (code+data):
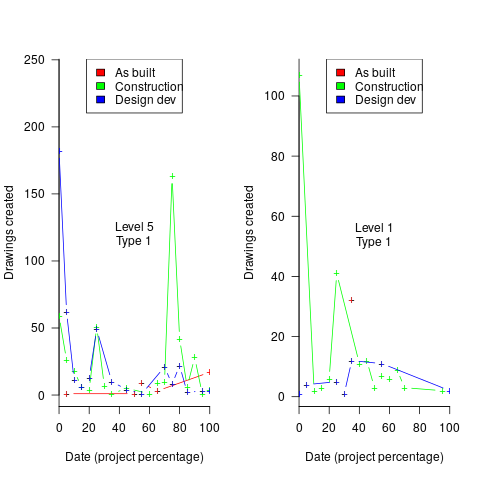
The path to the above plot is a common one: discover an interesting pattern in data, notice that something does not look right, use domain knowledge to refine the data analysis (e.g., kinds of drawing or contract), rinse and repeat.
My particular interest is using data to understand software engineering processes. How do these patterns in construction drawings compare with patterns in the software project equivalents, e.g., detailed requirements?
I am not aware of any detailed public data on requirements produced using a waterfall process. So the answer is, I don’t know; but the rationales I heard for the various kinds of drawings sound as-if they would have equivalents in the software requirements world.
What about the other data provided by the challenge sponsor?
I plotted various quantities for the RFI data, but there wasn’t any “that’s interesting” response from the domain experts. Perhaps the genius behind the plot ideas will be recognized later, or perhaps one of the domain experts will suddenly realize what patterns should be present in RFI data on high performance projects (nobody is allowed to consider the possibility that the data has no practical use). It can take time for the consequences of data analysis to sink in, or for new ideas to surface, which is why I am happy for analysis conversations to stretch out over time. Our presentation deck included some RFI plots because there was RFI data in the challenge.
What is the software equivalent of construction RFIs? Perhaps issues in a tracking system, or Jira tickets? I did not think to talk more about RFIs with the domain experts.
How did team Designing-Success do?
In most hackathons, the teams that stay the course present at the end of the hack. For these ProjectHacks, submission deadline is the following day; the judging is all done later, electronically, based on the submitted slide deck and video presentation. The end of this hack was something of an anti-climax.
Did team Designing-Success discover anything of practical use?
I think that finding patterns in the drawing data converted the domain experts from a theoretical to a practical understanding that it was possible to extract interesting patterns from construction data. They each said that they planned to attend the next hack (in about four months), and I suggested that they try to bring some of their own data.
Can these drawing creation patterns be used to help monitor project performance, as it progressed? The domain experts thought so. I suspect that the users of these patterns will be those not closely associated with a project (those close to a project are usually well aware of that fact that things are not going well).
Moore’s law was a socially constructed project
Moore’s law was a socially constructed project that depended on the coordinated actions of many independent companies and groups of individuals to last for as long it did.
All products evolve, but what was it about Moore’s law that enabled microelectronics to evolve so much faster and for longer than most other products?
Moore’s observation, made in 1965 based on four data points, was that the number of components contained in a fabricated silicon device doubles every year. The paper didn’t make this claim in words, but a line fitted to four yearly data points (starting in 1962) suggested this behavior continuing into the mid-1970s. The introduction of IBM’s Personal Computer, in 1981 containing Intel’s 8088 processor, led to interested parties coming together to create a hugely profitable ecosystem that depended on the continuance of Moore’s law.
The plot below shows Moore’s four points (red) and fitted regression model (green line). In practice, since 1970, fitting a regression model (purple line) to the number of transistors in various microprocessors (blue/green, data from Wikipedia), finds that the number of transistors doubled every two years (code+data):
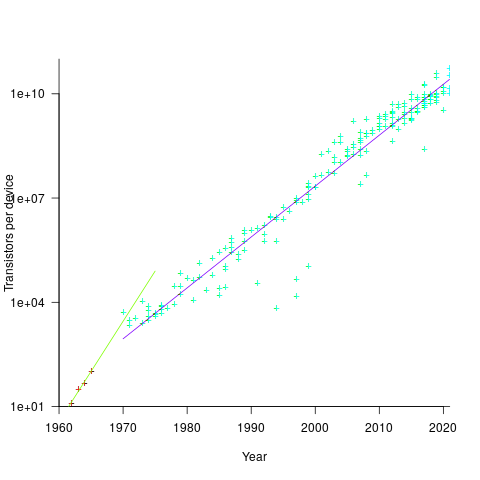
In the early days, designing a device was mostly a manual operation; that is, the circuit design and logic design down to the transistor level were hand-drawn. This meant that creating a device containing twice as many transistors required twice as many engineers. At some point the doubling process either becomes uneconomic or it takes forever to get anything done because of the coordination effort.
The problem of needing an exponentially-growing number of engineers was solved by creating electronic design automation tools (EDA), starting in the 1980s, with successive generations of tools handling ever higher levels of abstraction, and human designers focusing on the upper levels.
The use of EDA provides a benefit to manufacturers (who can design differentiated products) and to customers (e.g., products containing more functionality).
If EDA had not solved the problem of exponential growth in engineers, Moore’s law would have maxed-out in the early 1980s, with around 150K transistors per device. However, this would not have stopped the ongoing shrinking of transistors; two economic factors independently incentivize the creation of ever smaller transistors.
When wafer fabrication technology improvements make it possible to double the number of transistors on a silicon wafer, then around twice as many devices can be produced (assuming unchanged number of transistors per device, and other technical details). The wafer fabrication cost is greater (second row in table below), but a lot less than twice as much, so the manufacturing cost per device is much lower (third row in table).
The doubling of transistors primarily provides a manufacturer benefit.
The following table gives estimates for various chip foundry economic factors, in dollars (taken from the report: AI Chips: What They Are and Why They Matter). Node, expressed in nanometers, used to directly correspond to the length of a particular feature created during the fabrication process; these days it does not correspond to the size of any specific feature and is essentially just a name applied to a particular generation of chips.
Node (nm) 90 65 40 28 20 16/12 10 7 5 Foundry sale price per wafer 1,650 1,937 2,274 2,891 3,677 3,984 5,992 9,346 16,988 Foundry sale price per chip 2,433 1,428 713 453 399 331 274 233 238 Mass production year 2004 2006 2009 2011 2014 2015 2017 2018 2020 Quarter Q4 Q4 Q1 Q4 Q3 Q3 Q2 Q3 Q1 Capital investment per wafer 4,649 5,456 6,404 8,144 10,356 11,220 13,169 14,267 16,746 processed per year Capital consumed per wafer 411 483 567 721 917 993 1,494 2,330 4,235 processed in 2020 Other costs and markup 1,293 1,454 1,707 2,171 2,760 2,990 4,498 7,016 12,753 per wafer |
The second economic factor incentivizing the creation of smaller transistors is Dennard scaling, a rarely heard technical term named after the first author of a 1974 paper showing that transistor power consumption scaled with area (for very small transistors). Halving the area occupied by a transistor, halves the power consumed, at the same frequency.
The maximum clock-frequency of a microprocessor is limited by the amount of heat it can dissipate; the heat produced is proportional to the power consumed, which is approximately proportional to the clock-frequency. Instead of a device having smaller transistors consume less power, they could consume the same power at double the frequency.
Dennard scaling primarily provides a customer benefit.
Figuring out how to further shrink the size of transistors requires an investment in research, followed by designing/(building or purchasing) new equipment. Why would a company, who had invested in researching and building their current manufacturing capability, be willing to invest in making it obsolete?
The fear of losing market share is a commercial imperative experienced by all leading companies. In the microprocessor market, the first company to halve the size of a transistor would be able to produce twice as many microprocessors (at a lower cost) running twice as fast as the existing products. They could (and did) charge more for the latest, faster product, even though it cost them less than the previous version to manufacture.
Building cheaper, faster products is a means to an end; that end is receiving a decent return on the investment made. How large is the market for new microprocessors and how large an investment is required to build the next generation of products?
Rock’s law says that the cost of a chip fabrication plant doubles every four years (the per wafer price in the table above is increasing at a slower rate). Gambling hundreds of millions of dollars, later billions of dollars, on a next generation fabrication plant has always been a high risk/high reward investment.
The sales of microprocessors are dependent on the sale of computers that contain them, and people buy computers to enable them to use software. Microprocessor manufacturers thus have to both convince computer manufacturers to use their chip (without breaking antitrust laws) and convince software companies to create products that run on a particular processor.
The introduction of the IBM PC kick-started the personal computer market, with Wintel (the partnership between Microsoft and Intel) dominating software developer and end-user mindshare of the PC compatible market (in no small part due to the billions these two companies spent on advertising).
An effective technique for increasing the volume of microprocessors sold is to shorten the usable lifetime of the computer potential customers currently own. Customers buy computers to run software, and when new versions of software can only effectively be used in a computer containing more memory or on a new microprocessor which supports functionality not supported by earlier processors, then a new computer is needed. By obsoleting older products soon after newer products become available, companies are able to evolve an existing customer base to one where the new product is looked upon as the norm. Customers are force marched into the future.
The plot below shows sales volume, in gigabytes, of various sized DRAM chips over time. The simple story of exponential growth in sales volume (plus signs) hides the more complicated story of the rise and fall of succeeding generations of memory chips (code+data):
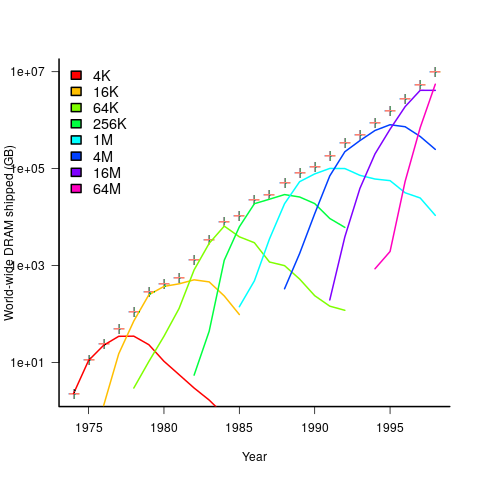
The Red Queens had a simple task, keep buying the latest products. The activities of the companies supplying the specialist equipment needed to build a chip fabrication plant has to be coordinated, a role filled by the International Technology Roadmap for Semiconductors (ITRS). The annual ITRS reports contain detailed specifications of the expected performance of the subsystems involved in the fabrication process.
Moore’s law is now dead, in that transistor doubling now takes longer than two years. Would transistor doubling time have taken longer than two years, or slowed down earlier, if:
- the ecosystem had not been dominated by two symbiotic companies, or did network effects make it inevitable that there would be two symbiotic companies,
- the Internet had happened at a different time,
- if software applications had quickly reached a good enough state,
- if cloud computing had gone mainstream much earlier.
Recent Comments