Archive
Automatically generated join-the-dots images
It is interesting to try and figure out what picture emerges from a join-the-dots puzzle (connect-the-dots in some parts of the world). Let’s have a go at some lightweight automatic generation such a puzzle (some heavy-weight techniques).
If an image is available, expressed as an boolean matrix, R’s sample function can be used to select a small percentage of the black points.
Taking the output of the following equation:
x=seq(-4.7, 4.7, by=0.002) y1 = c(1,-.7,.5)*sqrt(c(1.3, 2,.3)^2 - x^2) - c(.6,1.5,1.75) # 3 y2 =0.6*sqrt(4 - x^2)-1.5/as.numeric(1.3 <= abs(x)) # 1 y3 = c(1,-1,1,-1,-1)*sqrt(c(.4,.4,.1,.1,.8)^2 -(abs(x)-c(.5,.5,.4,.4,.3))^2) - c(.6,.6,.6,.6,1.5) # 5 y4 =(c(.5,.5,1,.75)*tan(pi/c(4, 5, 4, 5)*(abs(x)-c(1.2,3,1.2,3)))+c(-.1,3.05, 0, 2.6))/ as.numeric(c(1.2,.8,1.2,1) <= abs(x) & abs(x) <= c(3,3, 2.7, 2.7)) # 4 y5 =(1.5*sqrt(x^2 +.04) + x^2 - 2.4) / as.numeric(abs(x) <= .3) # 1 y6 = (2*abs(abs(x)-.1) + 2*abs(abs(x)-.3)-3.1)/as.numeric(abs(x) <= .4) # 1 y7 =(-.3*(abs(x)-c(1.6,1,.4))^2 -c(1.6,1.9, 2.1))/ as.numeric(c(.9,.7,.6) <= abs(x) & abs(x) <= c(2.6, 2.3, 2)) # 3 |
and sampling 300 of the 20,012 points we get images such as the following:

A relatively large sample size is needed to reduce the possibility that a random selection fails to return any points within a significant area, but we do end up with many points clustered here and there.
library("plyr")

rab_points=adply(x, 1, function(X) data.frame(x=rep(X, 18), y=c(
	c(1, -0.7, 0.5)*sqrt(c(1.3, 2, 0.3)^2-X^2) - c(0.6, 1.5 ,1.75),
	0.6*sqrt(4 - X^2)-1.5/as.numeric(1.3 <= abs(X)),
	c(1, -1, 1, -1, -1)*sqrt(c(0.4, 0.4, 0.1, 0.1, 0.8)^2-(abs(X)-c(0.5, 0.5, 0.4, 0.4, 0.3))^2) - c(0.6, 0.6, 0.6, 0.6, 1.5),
	(c(0.5, 0.5, 1, 0.75)*tan(pi/c(4, 5, 4, 5)*(abs(X)-c(1.2, 3, 1.2, 3)))+c(-0.1, 3.05, 0, 2.6))/
		as.numeric(c(1.2, 0.8, 1.2, 1) <= abs(X) & abs(X) <= c(3,3, 2.7, 2.7)),
	(1.5*sqrt(X^2+0.04) + X^2 - 2.4) / as.numeric(abs(X) <= 0.3),
	(2*abs(abs(X)-0.1)+2*abs(abs(X)-0.3)-3.1)/as.numeric(abs(X) <= 0.4),
	(-0.3*(abs(X)-c(1.6, 1, 0.4))^2-c(1.6, 1.9, 2.1))/
		as.numeric(c(0.9, 0.7, 0.6) <= abs(X) & abs(X) <= c(2.6, 2.3, 2))
						)))
rab_points$X1=NULL
rb=subset(rab_points, (!is.na(x)) & (!is.na(y) & is.finite(y)))

x=sample.int(nrow(rb), 300)
plot(rb$x[x], rb$y[x],
bty="n", xaxt="n", yaxt="n", pch=4, cex=0.5, xlab="", ylab="") |
A more uniform image can produced by removing all points less than a given distance from some selected set of points. In this case the point in the first element is chosen, everything close to it removed and the the processed repeated with the second element (still remaining) and so on.
rm_nearest=function(jp)
{
keep=((dot_im$x[(jp+1):(jp+window_size)]-dot_im$x[jp])^2+
      (dot_im$y[(jp+1):(jp+window_size)]-dot_im$y[jp])^2) < min_dist
keep=c(keep, TRUE) # make sure which has something to return
return(jp+which(keep))
}

window_size=500
cur_jp=1
dot_im=rb

while (cur_jp <= nrow(dot_im))
   {
#   min_dist=0.05+0.50*runif(window_size)
   min_dist=0.05+0.30*runif(1)
   dot_im=dot_im[-rm_nearest(cur_jp), ]
   cur_jp=cur_jp+1
   }

plot(dot_im$x, dot_im$y,
bty="n", xaxt="n", yaxt="n", pch=4, cex=0.5, xlab="", ylab="") |
Since R supports vector operations I want to do everything without using loops or if-statements. Yes, there is a while loop :-(, alternative, simple, non-loop suggestions welcome.
Removing points with an average squared distance less than 0.3 and 0.5 we get (with around 135-155 points) the images:

I was going to come up with a scheme for adding numbers, perhaps I will do this in another post.
Click for more equations generating images.
Producing software for money and/or recognition
In the commercial environment money makes the world go around, while in academia recognition (e.g., number of times your work is cited, being fawned over at conferences, impressive job titles) is the coin of the realm (there are a few odd balls who do it out of love for the subject or a desire to understand how things work, but modern academia is a large bureaucracy whose primary carrot is recognition).
There is an incentive problem for those writing software in academia; software does not attract much, if any, recognition.
Does the lack of recognition for writing software matter? Surely what counts are the research results, not the tools used to get there (be they writing software or doing mathematics).
A recent paper bemoans the lack of recognition for the development of Python packages for Astronomy researchers. Well, its too late now, they have written the software and everybody gets to make perfect copies for free.
What the authors of Astropy want, is for researchers who use this software to include a citation to it in any published papers. Do all 162 authors deserve equal credit? If a couple of people add a new package, should they get a separate citation? What if a new group of people take over maintenance, when should the citation switch over from the old authors/maintainers to the new ones? These are a couple of the thorny questions that need to be answered.
R is perhaps the most widely used academic developed software ecosystem. A small dedicated group of people has invested a lot of their time over many years to make something special. A lot more people have invested effort to create a wide variety of add-on packages.
The base R library includes the citation function, which returns the BibTeX information for a given package; ready to be added to a research papers work flow.
Both commercial and academic producers need to periodically create new versions to keep ahead of the competition, attract more customers and obtain income. While they both produce software to obtain ‘income’, commercial and academic software systems have different incentives when it comes to support for end users of the software.
Keeping existing customers happy is the way to get them to pay for upgrades and this means maintaining compatibility with what went before. Managers in commercial companies make sure that developers don’t break backwards compatibility (developers hate having to code around what went before and would love to throw it all away).
In the academic world it does not matter whether end users upgrade, as long as they cite the package, the version used is irrelevant; so there is a lot less pressure to keep backwards compatibility. Academics are supposed to create new stuff, they are researchers after all, so the incentives are pushing them to create brand new packages/systems to be seen as doing new stuff (and obtain a whole new round of citations). A good example is Hadley Wickham, who has created some great R packages, who seems to be continually moving on, e.g., reshape -> reshape2 -> tidyr (which is what any good academic is supposed to do).
The run-time performance of a system is something end users always complain about, but often get used to. The reason is invariably that there is little or no incentive to address this issue (for both commercial and academic systems). Microsoft Windows is slower than it need be and the R interpreter could go a lot faster (the design of the interpreter looks like something out of the 1980s; I’m seeing a lot of packages in R only, so the idea that R programs spend all their time executing in C/Fortran libraries may be out of date. Where is the incentive to use post-2000 designs?)
How many new versions of a software package can be produced before enough people stop being willing to pay for an update? How many different packages solving roughly the same problem can academics produce?
I don’t think producing new packages for income has a long term future.
Software engineering data sets
The pretty pictures from my empirical software engineering book are now online, along with the 210 data sets and R code (330M).
Plotting the number of data sets in each year shows that empirical software engineering has really taken off in the last 10 years (code+data). Around dozen or so confidential data sets are not included; I am only writing about data that can be made public.
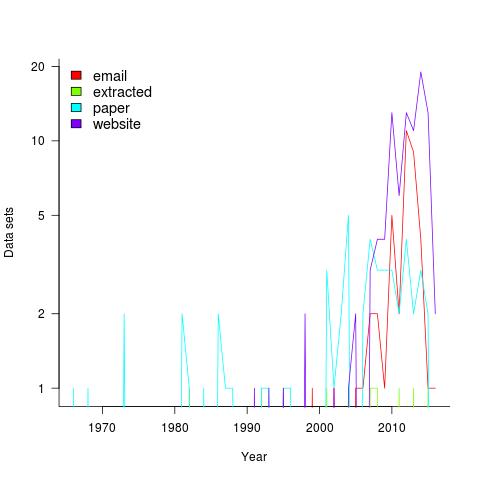
It used to be rare to find the data associated with a paper on the author’s website. Of course, before around 1995 there was no web, but since around 2012 the idea has started to take off.
Contact via email goes back to 1985 and before that people sent mag tapes through the post and many years ago somebody sent me punched tape (there is nothing like seeing the bits with the naked eye).
I have sent several hundred emails asking for data and received 55 data sets. I’m hoping this release will spur those who have promised me data to invest some time to send it.
My experience is that research data often lives on laptops and dies when the laptop is replaced (a study of biologists, who have been collecting data for hundreds of years, found a data ‘death rate’ of 17% a year). Had I started actively collecting data before 2010 the red line in the plot would be much higher for earlier years; I often received data from authors when writing my C book at the start of the century (Google went from nothing to being the best place to search, while I wrote).
In nine cases I extracted the data, either from the pdf or an image and then reverse engineered values.
I have around 50 data sets waiting to be processed. Given that lots more are bound to arrive before the book is finished, I expect to easily reach the 300 mark. A tiny number given my aim of writing about all software engineering issues for which public data exists.
If you know of interesting software engineering data, that is not to be found in these plots, please let me know.
cpu+FPGA: applications can soon have bespoke instructions
Compiler writers are always frustrated that the cpu they are currently targeting does not contain the one instruction that would enable them to generate really efficient code. If only it were possible to add new instructions to the cpu. Well, it looks like this will soon be possible; Intel have added an on chip FPGA to their Broadwell processor (available circa 2017).
Having custom instructions on a FPGA (they would be loaded at program startup) is not the same as having the instructions on the cpu itself, there will be communication overhead when the data operated on by the custom instruction get transferred back and forth between cpu/FPGA (being on-chip means this will be low). To make the exercise worthwhile the custom instruction has to do something that takes very many cycles on the cpu and either speeds it up or reduces the power consumed (the Catapult project at Microsoft has a rack of FPGA enhanced machines speeding up/reducing the power of matching search engine queries to documents).
A CPU+FPGA is like CPU+GPU, except that FPGAs are programmed at a much lower level, i.e., there is little in the way of abstraction between what the hardware does and what the coder sees.
Does the world need a FPGA attached to their cpu? Most don’t but there are probably a few customers who do, e.g., data centers with systems performing dedicated tasks and anybody into serious bit twiddling. Other considerations include Intel needing to add new bells and whistles to its product so that customers who have been trained over the years to buy the very latest product (which has the largest margins) stay on the buying treadmill. The FPGA is also a differentiator, not that Intel would ever think of AMD as a serious competitor.
Initially the obvious use case is libraries performing commonly occurring functionality. No, not matrix multiple and inverse, FPGA are predominantly integer operation units (there are approaches using non-standard floating-point formats that can be used if your FPGA unit does not have floating-point support).
From the compiler perspective the use case is spotting cpu intensive loops, where all the data can be held on the FPGA until processing is complete. Will there be enough of these loops to make it a worthwhile implementation target? I suspect not. But then I can see many PhDs being written on this topic and one of them could produce a viable implementation that bootstraps itself into one of the popular open source compilers.
Interpreters have to do a lot of housekeeping work. Perhaps programs written in Java or R could be executed on the FPGA that uses the cpu as a slave processor. It is claimed that most R programs spend their time in library functions that have been implemented in C and Fortran, but I’m seeing more and more code that appears to be all R. For some programs an R-machine implemented in hardware could produce orders of magnitude speed improvements.
The next generation of cryptocurrency proof-of-work algorithms are being designed to be memory intensive, so they cannot be efficiently implemented using ASIC-proof (this prevents mining being concentrated in a few groups who have built bespoke mining operations). The analysis I have seen is based on ‘conventional’ cpu and ASIC designs. A cpu+FPGA is a very different kind of beast and one that might require another round of cryptocurrency design.
These cpu+FPGA processors have the potential to dramatically upend existing approaches to structuring programs. Very interesting times ahead!
Workshop on survival and time series analysis in empirical SE
In January the material in my book on Empirical software engineering using R had its first exposure to professional software developers at a one day workshop (there was a rerun last week; slides here). The sessions were both fully booked, but as often happens on half turned up, around 15 at each workshop. A couple of people turned up expecting to be taught R and found themselves in a software engineering workshop that assumed the attendees could learn R in 10 minutes (because professional developers are experienced enough to learn the basics of programming in any language in that amount of time).
The main feedback was that people wanted to see more code, something to give them a starting point for the hands-on sessions (I hate seeing reams and reams of code on slides and had gone too far in the minimalist direction).
The approach of minimizing what developers have to learn/remember, even if it means using more computer resources (e.g., always using glm), went down very well.
The probability & statistics material, in the session before lunch, had a mixed reception; this is partly because I have not come up with a clear message and I’m trying to get over several disparate ideas, i.e., sampling issues, life is complicated and p-values. People were a bit unhappy about the life is complicated, data is messy and you have to think about what you are doing message.
I think the regression model building material was a hit. People saw the potential in fitting curves to data and found it easy to do once the parameters to plot, lines, glm and predict were sorted out. There was lots of interesting discussion around interpreting the fitted models, with me continually hamming on the point that p-value selection was a business risk factor decision and what constituted a good model depended on what it was going to be used for.
Those attending wanted to learn more, which is great since the main aim was to show people what useful things could be done to motivate them to go off and learn more (relatively little may be known about empirical software engineering, but there is more than can be fitted into a one day workshop)
There is a part-2 workshop in March and the plan is to cover survival analysis, time series analysis and if there is time something else. It will be assumed that people have the skill level of those who attended the first workshop, e.g., can write basic R and fit a simple regression model.
Thanks to The Rise for sponsoring the venue for all three workshops.
subset vs array indexing: which will cause the least grief in R?
The comments on my post outlining recommended R usage for professional developers were universally scornful, with my proposal recommending subset receiving the greatest wrath. The main argument against using subset appeared to be that it went against existing practice, one comment linked to Hadley Wickham suggesting it was useful in an interactive session (and by implication not useful elsewhere).
The commenters appeared to be knowledgeable R users and I suspect might have fallen into the trap of thinking that having invested time in obtaining expertise of language intricacies, they ought to use these intricacies. Big mistake, the best way to make use of language expertise is to use it to avoid the intricacies, aiming to write simply, easy to understand code.
Let’s use Hadley’s example to discuss the pros and cons of subset vs. array indexing (normally I have lots of data to help make my case, but usage data for R is thin on the ground).
Some data to work with, which would normally be read from a file.
sample_df = data.frame(a = 1:5, b = 5:1, c = c(5, 3, 1, 4, 1)) |
The following are two of the ways of extracting all rows for which a >= 4:
subset(sample_df, a >= 4) # has the same external effect as: sample_df[sample_df$a >= 4, ] |
The subset approach has the advantages:
- The array name,
sample_df, only appears once. If this code is cut-and-pasted or the array name changes, the person editing the code may omit changing the second occurrence. - Omitting the comma in the array access is an easy mistake to make (and it won’t get flagged).
- The person writing the code has to remember that in R data is stored in row-column order (it is in column-row order in many languages in common use). This might not be a problem for developers who only code in R, but my target audience are likely to be casual R users.
The case for subset is not all positive; there is a use case where it will produce the wrong answer. Let’s say I want all the rows where b has some computed value and I have chosen to store this computed value in a variable called c.
c=3 subset(sample_df, b == c) |
I get the surprising output:
> a b c > 1 1 5 5 > 5 5 1 1 |
because the code I have written is actually equivalent to:
sample_df[sample_df$b == sample_df$c, ] |
The problem is caused by the data containing a column having the same name as the variable used to hold the computed value that is tested.
So both subset and array indexing are a source of potential problems. Which of the two is likely to cause the most grief?
Unless the files being processed each potentially contain many columns having unknown (at time of writing the code) names, I think the subset name clash problem is much less likely to occur than the array indexing problems listed earlier.
Its a shame that assignment to subset is not supported (something to consider for future release), but reading is the common case and that is what we are interested in.
Yes, subset is restricted to 2-dimensional objects, but most data is 2-dimensional (at least in my world). Again concentrate recommendations on the common case.
When a choice is available, developers should pick the construct that is least likely to cause problems, and trivial mistakes are the most common cause of problems.
Does anybody have a convincing argument why array indexing is to be preferred over subset (not common usage is the reason of last resort for the desperate)?
R recommended usage for professional developers
R is not one of those languages where there is only one way of doing something, the language is blessed/cursed with lots of ways of doing the same thing.
Teaching R to professional developers is easy in the sense that their fluency with other languages will enable them to soak up this small language like a sponge, on the day they learn it. The problems will start a few days after they have been programming in another language and go back to using R; what they learned about R will have become entangled in their general language knowledge and they will be reduced to trial and error, to figure out how things work in R (a common problem I often have with languages I have not used in a while, is remembering whether the if-statement has a then keyword or not).
My Empirical software engineering book uses R and is aimed at professional developers; I have been trying to create a subset of R specifically for professional developers. The aims of this subset are:
- behave like other languages the developer is likely to know,
- not require knowing which way round the convention is in R, e.g., are 2-D arrays indexed in row-column or column-row order,
- reduces the likelihood that developers will play with the language (there is a subset of developers who enjoy exploring the nooks and crannies of a language, creating completely unmaintainable code in the process).
I am running a workshop based on the book in a few weeks and plan to teach them R in 20 minutes (the library will take a somewhat longer).
Here are some of the constructs in my subset:
- Use
subsetto extract rows meeting some condition. Indexing requires remembering to do it in row-column order and weird things happen when commas accidentally get omitted. - Always call
read.csvwith the argumentas.is=TRUE. Computers now have lots of memory and this factor nonsense needs to be banished to history. - Try not to use for loops. This will probably contain array/data.frame indexing, which provide ample opportunities for making mistakes, use the
*applyor*plyfunctions (which have the added advantage of causing code to die quickly and horribly when a mistake is made, making it easier to track down problems). - Use
headto remove the lastNelements from an object, e.g.,head(x, -1)returns x with the last element removed. Indexing with the length minus one is a disaster waiting to happen.
It’s a shame that R does not have any mechanism for declaring variables. Experience with other languages has shown that requiring variables to be declared before use catches lots of coding errors (this could be an optional feature so that those who want their ‘freedom’ can have it).
We now know that support for case-sensitive identifiers is a language design flaw, but many in my audience will not have used a language that behaves like this and I have no idea how to help them out.
There are languages in common use whose array bounds start at one. I will introduce R as a member of this club. Not much I can do to help out here, except the general suggestion not to do array indexing.
Suggestions based on reader’s experiences welcome.
R is now important enough to have a paid for PR make-over
With the creation of the R consortium R has moved up a rung on the ladder of commercial importance.
R has captured the early adopters and has picked up a fair few of the early majority (I’m following the technology adoption life-cycle model made popular by the book Crossing the Chasm), i.e., it is starting to become mainstream. Being mainstream means that jobsworths are starting to encounter the language in situations of importance to them. How are the jobsworths likely to perceive R? From my own experience I would say it will be perceived as being an academic thing, which in the commercial world is not good, not good at all.
To really become mainstream R needs to shake off its academic image, and as I see it, the R consortium has been set up to make that happen. I imagine it will try to become the go-to point for journalists wanting information or a quote about things-related-to R. Yes, they will hold conferences with grandiose sounding titles and lots of business people will spend surprising amounts of money to attend, but the real purpose is to solidify the image of R as a commercial winner (the purpose of a very high conference fee is to keep the academics out and convince those attending that it must be important because it is so expensive).
This kind of consortium gets set up when some technology having an academic image is used by large companies that need to sell this usage to potential customers (if the technology is only used internally its wider image is unimportant).
Unix used to have an academic image, one of the things that X/Open was set up to ‘solve’. The academic image is now a thing of the past.
For the first half of the 1980s it looked like Pascal would be a mainstream language; a language widely taught in universities and perceived as being academic. Pascal did not get its own consortium and C came along and took its market (I was selling Pascal tools at the time and had lots of conversations with companies who were switching from Pascal to C and essentially put the change down to perception; it did not help that Pascal implementations did their best to hide/ignore the 8086 memory model, something of interest when memory is scarce).
How will we know when R reaches the top rung (if it does)? Well there are two kinds of languages, those that nobody uses and those that everybody complains about.
R will be truly mainstream once people feel socially comfortable complaining about it to any developer they are meeting for the first time.
Aggregate player preference for the first 20 building created in Illyriad
I was at the Microsoft Gaming data hackathon today. Gaming is very big business and companies rarely publish detailed game data. Through contacts one of the organizers was able to obtain two gaming datasets, both containing just under 300M of compressed of data.
Illyriad supplied a random snapshot of anonymised data on 50,000 users and Mediatonic supplied three months of player data.
Being a Microsoft event there were lots of C# developers, with data analysis people being thin on the ground. While there were plenty of gamers present I could not find any that knew the games for which we had data (domain experts are always in short supply at hackathons).
I happened to pick the Illyriad data to investigate first and stayed with it. The team sitting next to us worked on the Mediatonic data and while I got to hear about this data and kicked a few ideas around with them, I did not look at it.
The first thing to do with any dataset is to become familiar with what data it actually contains and the relationships between different items. I was working with two people new to data science who wanted to make the common beginner mistake of talking about interesting things we could do; it took a while for my message of “no point of talking about what we could do with the data until we know what data we have” to have any effect. Of course it is always worth listening to what a domain expert is interested in before looking at the data, as a source of ideas to keep in mind; it is not worth keeping in mind ideas from non-domain experts.
Quick Illyriad game overview: Players start with a settlement and construct/upgrade buildings until they have a legendary city. These buildings can generate resources such as food and iron; towns/cities can be conquered and colonized… you get the picture.
My initial investigation of the data did not uncover any of the obvious simple patterns, but did manage to find a way of connecting some pairs of players in a transaction relationship (the data for each player included a transaction list which gave one of 255 numeric locations and the transaction amount; I reasoned that the location/amount pair was likely to be unique).
The data is a snapshot in time, which appeared to rule out questions involving changes over time. Finally, I realized that time data was present in the form of the order in which each player created buildings in their village/town/city.
Buildings are the mechanism through which players create resources. What does the data have to say about gamers preferential building construction order? Do different players with different playing strategies use different building construction orders?
A search of the Illyriad website located various beginners’ guides containing various strategy suggestions, depending on player references for action.
Combining the order of the first 20 different buildings, created by all 50,000 players, into an aggregate preference building order we get:
Library Storehouse Lumberjack Clay Pit Farmyard Marketplace Quarry Iron Mine Barracks Consulate Mage Tower Paddock Common Ground Brewery Tavern Spearmaker Tannery Book Binder Flourmill Architects` Office |
A couple of technical points: its impractical to get an exact preference order for more than about 10 players and a Monti Carlo approach is used by RankAggreg and building multiple instance of the same kind of building were treated as a single instance (some form of weighting might be used to handle this behavior):
The order of the top three ranked buildings is very stable, but some of the buildings in lower ranks could switch places with adjacent buildings with little impact on ranking error.
Do better players use different building orders than poor players? The data does not include player ability data as such; it included game ranking (a high ranking might be achieved quickly by a strong player or slowly over a longer period by a weaker player) and various other rankings (some of which could be called sociability).
Does the preference for buildings change as a players’ village becomes a town becomes a city? At over 200 minutes of cpu time per run I have not yet had the time to find out. Here is the R code for you to try out some ideas:
library("plyr")
library("RankAggreg")

get_build_order=function(df)
{
# Remove duplicates for now
dup=duplicated(df$building_id)

# Ensure there are at least 20
build_order=c(df$building_id[!dup], -1:-20)
return(build_order[1:20])
}

# town_id,building_id,build_order_for_town
#1826159E-976D-4743-8AEB-0001281794C2,7,1
build=read.csv("~/illyriad/town_buildings.csv", as.is=TRUE)

build_order=daply(build, .(town_id), get_build_order)

build_rank=RankAggreg(build_order, 20) |
What did other teams discover in the data? My informal walk around on Saturday evening found everybody struggling to find anything interesting to talk about (I missed the presentation on Sunday afternoon, perhaps a nights sleep turned things around for people, we will have to check other blogs for news).
If I was to make one suggestion to the organizers of the next gaming data hackathon (I hope there is one), it would be to arrange to have some domain experts (i.e., people very familiar with playing the games) present.
ps. Thanks to Richard for organizing chicken for the attendee who only eats pizza when truly starving.
Update
R’s plot function, the 1970’s retro look is not cool any more
Casual users of a system want to learn a few simple rules that enable them to get most things done. Many languages have a design principle of only providing one way of doing things. Members of one language family are known for providing umpteen different ways of doing something and R is no exception.
R comes with the plot function as part of the base system. I am an admirer of plot‘s ability to take whatever is thrown at it and generally produce a workman-like graphical image; workman-like is a kinder description than 1970’s retro look.
R has a thriving library of add-on packages and the package ggplot2 is a byword for fancy graphics in the R community. Anybody reading the description of the qplot function, in this package, would think it is the death kneel for plot. They would be wrong, qplot contains a fatal flaw, it does a very poor job of handling the simple stuff (often generating weird error messages in the process).
In the beginning I’m sure Hadley Wickham, the design+implementor of ggplot/ggplot2, was more concerned with getting his ideas implemented and was not looking to produce a replacement for plot. Unfortunately it looks as-if the vision for functions in the ggplot package is as high-end plot replacements (i.e., for power users) and not as universal plot replacements (i.e., support for casual users).
This leaves me pulling my hair out trying to produce beautiful looking graphs for a book I am working on. The readership are likely to be casual users of R and I am trying to recommend one way of doing something for every task. The source code+data of all the examples will be freely available and I’m eating my own dog food, so its plot I have to use.
Recent Comments