Archive
Half-life of Open source research software projects
The evidence for applications having a half-life continues to spread across domains. The first published data covered IBM mainframe applications up to 1992 (half-life of at least 5-years), and was mostly ignored. Then, the data collected by Killed by Google up to 2018, showed a half-life of at least 3-years for Google apps. More recently, the data collected by Killed by Microsoft up to 2025, showed a half-life of at least 7-years for Microsoft apps (perhaps reflecting the maturity of the company’s product line).
The half-life of source code, independent of the lifetime of the application it implements, is a separate topic.
Scientific software created to support researchers is an ecosystem whose incentives and means of production can be very different from commercial software. Does researcher oriented software die when the grant money runs out, or the researcher moves on to the next fashionable topic, or does it live on as the field expands?
The paper Scientific Open-Source Software Is Less Likely to Become Abandoned Than One Might Think! Lessons from Curating a Catalog of Maintained Scientific Software by Thakur, Milewicz, Jahanshahi, Paganini, Vasilescu, and Mockus analysed 14,418 scientific software systems written in Python (53%), C/C++ (25%), R (12%), Java (8%) or Fortran (2%). The first half of the paper describes how World of Code‘s 209 million repos were filtered down to 350,308 projects containing README files, these READMEs were processed by LLMs to extract information and further filter out projects.
The authors collected the usual information about each Open source project, e.g., number of core developers, number of commits, programming language, etc. They also collected information about the research domain, e.g., scientific field (biology, chemistry, mathematics, etc.), funding, academic/government associations, etc. A Cox proportional hazards model was fitted to this data, with project lifetime being the response variable. A project was deemed to have been abandoned when no changes had been made to the code for at least six consecutive months (we can argue over whether this is long enough).
Including all the different factors created a Cox model that did a good job of explaining the variance in project survival rate. No one factor dominated, and there was a lot of overlap in the confidence bounds of the components of each factor, e.g., different research domains. I have always said that programming language has no impact on project lifetime; the language factor of the fitted model was not statistically significant (two of the languages just sneaked in under the 5% bar), which can be interpreted as being consistent with my opinion.
Each project was categorised as one of: Scientific Domain-specific code (73.5%), Scientific infrastructure (16.5%), or Publication-Specific code (10%). The plot below shows the Kaplan-Meier survival curve for these three categories (note: y-axis is logarithmic), with faint grey lines showing a fitted exponential for each survival curve (only 3% of projects are abandoned in the first year, and the exponential fits are to the data after the first year; code+data):
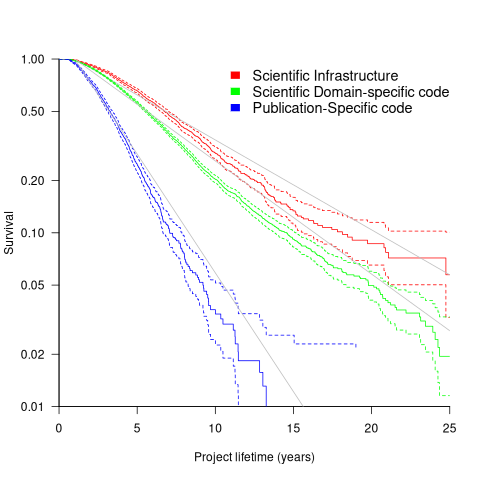
Readers familiar with academic publishing will not be surprised that projects associated with published papers have the lowest survival rate (half-life just over 2-years). Infrastructure projects are likely to be depended on by many people, who all have an interest in them surviving (half-life around 6-years). The Domain-specific half-life is around 4.5-years.
The results of this study show software systems in various research ecosystems having a range of half-lives in the same range as three major commercial software ecosystems.
Unfortunately, my experience of discussing application half-life with developers is that they believe in an imagined future where software never dies. That is, they are unwilling to consider a world where software has a high probability of being abandoned, because it requires that they consider the return on investment before spending time polishing their code.
Half-life of Microsoft products is 7 years
I get a lot of pushback from developers/managers when I tell them that the average application has a relatively short lifetime, i.e., half-life of 4-8 years. The pushback kicks in when I start citing data, up until then my listeners appear surprised/skeptical. The fact that source code has a brief and lonely existence is accepted, but telling them about the (one study) evidence that a coding mistake is more likely to disappear because of an unrelated coding change than as a result of fixing a fault report appears to make them feel uncomfortable.
Some applications live a long time, and most developers will spend most of their time working on long-lived applications. Short-lived applications are not around long enough to acquire significant developer/manager mind share.
I think the pushback is rooted in more than developer experience; developers don’t like the thought of their work disappearing from the world. The desire for permanence in what we create may be a human characteristic. Extolling the creation of reliable, maintainable, readable code creates an implicit assumption that applications are going to live long enough for the cost of these activities to be paid back.
How accurate are these half-life estimates?
The 4-8 year half-life range is derived from two datasets. A while ago I spotted another dataset: Fabiano Riccardi‘s Killed by Microsoft, currently containing information on 141 killed products.
All three datasets list just the products that have been killed, i.e., they are not a list of all products. A half-life calculation based only on killed products could underestimate the actual lifetime, it depends on whether the rate of killed products remains roughly the same percentage of all products or not. If the number of products killed, in any period, is always roughly the same percentage of all current products, then the calculated lifetime is not affected by the lack of data on the number of live products. Uncertainty in the calculated lifetime is created when the number of products killed is unconnected with the current number of live products.
It’s possible, to save money, products are more likely to be killed when a company is going through a period of poor performance, or the economy is in recession, compared to when business is booming.
Another source of uncertainty is sampling bias. Companies announce when products are released/withdrawn, creating recency bias because it’s easier to monitor the news than actively search for data on past product releases/withdraws. The plot below shows the number of products Microsoft killed in each year (red bars; post 2025 are to be killed-by dates) and number of new products launched each year blue/green line (code+data):
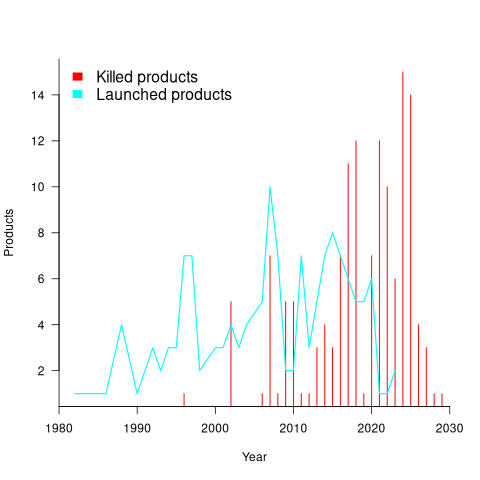
I’m sure that Microsoft killed more than one product before 2000. The Dot-com bubble burst in March 2000, and I would expect this to have resulted in lots of killed products. The lack of data on products killed before 2000 means that shorter lived products are undercounted.
The plot below shows the number of Microsoft (eventually killed) products still supported a given number of years after launch, the red line is a regression fit for products aged between 4 months and 22 years (code+data):
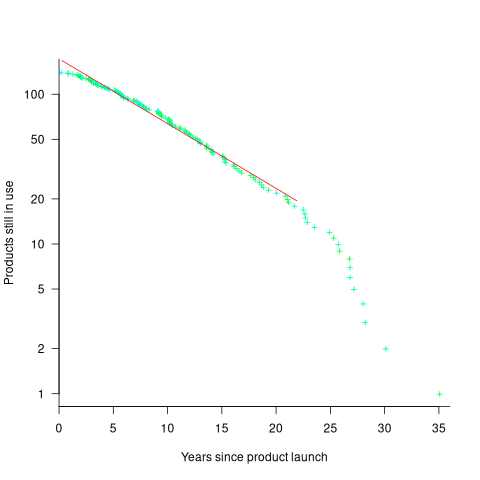
The half-life of the Microsoft products in this dataset, aged between 4 months and 22 years, is 7 years. Is the sharp decline in half-life after 22 years a real thing, or a consequence of the small amount of data before 2005? As always, more data is needed.
Recent Comments