The lifetime of performance coding issues
Coding activities that a developer might spend time on include: adding new functionality, fixing a reported fault, or fiddling with existing code with the intent of making it ‘better’ in some sense (which these days goes by the catch-all name of refactoring).
Improving performance, e.g., changing software to use less cpu/memory is considered, by developers, to make it ‘better’ (whether users are likely to notice the difference, or management see a ROI is for another article). There is a breed of developer whose DNA encodes for pleasure receptors that are only fire when working to reduce the amount of cpu/memory used by a program.
The paper Characterizing the evolution of statically-detectable performance issues of Android Apps by Das, Di Penta, and Malavolta studied the creation/removal of nine distinct performance coding issues in the source of 316 Android Apps (118 Apps contained five or more issues); a total of 2,408 performance issues were tracked.
What patterns might be present in the paper’s performance issues data?
I would expect there to be more creations in Apps containing more code, and more removals the longer an App is maintained; both very obvious. With more developers working on an App, there are going to be more creations and removals; do they cancel out? Management might decide to invest time in performance improvements for the next release, which would cause a spike in the number of removals per unit time.
How long do the nine performance issues survive in code, before being removed? The plot below shows the Kaplan Meier survival curve for Apps containing at least five issues (dotted blue/green are the 95% confidence intervals, code+data):
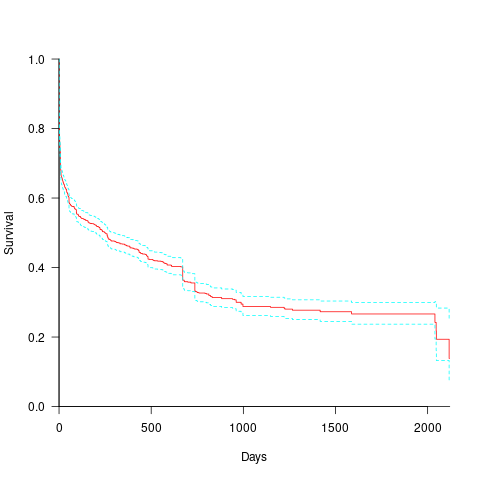
Around 15% of issues were removed on the day they are created, and by the eighth day around 30% had been removed. The roughly steady decline lasts for two-years, followed by almost stasis. Is two-years the active development lifetime of a successful Android App?
In isolation, the slope of the survival curve between eight days and two-years is not that interesting (it could be used to rule out models of the issue discovery process, e.g., happenstance discovery while working on other tasks). However, comparing it against the corresponding survival curve for reported faults tells us something about developer/management investment priorities for the two kinds of tasks, as measured by time to fix (which is a proxy for effort invested).
Unfortunately, this study did not collect information on coding mistake lifetimes, or time between a fault being reported and fixed. There have been studies investigating the survival time of coding mistakes. Reported faults should have the lowest survival rate, while the survival of coding mistakes will depend on the number of users (i.e., more users creates more opportunities to experience a fault and report it).
What factors influence performance issue time-to-fix?
The data includes information on the kind of performance issue, the number of times the App has been downloaded from the Google Play Store, and the number of contributors to the App.
Using these variables, a Cox proportional hazards model was fitted to model the survival time. In a proportional hazards model, the model coefficients are not absolute values, but provide ratio information. For instance, the following table shows the coefficients of the fitted model (code+data). Using these coefficients, we can compare the time taken to fix, say, a FloatMath issue relative to a ViewTag issue. The coefficient ratio  is the estimated ratio of fix times of the two respective issues.
Coefficient Standard error Performance issue FloatMath 0.64445 0.14175 HandlerLeak 0.69958 0.12736 Recycle 0.83041 0.11386 UseSparseArrays 0.73471 0.12493 UseValueOf 0.64263 0.11827 ViewHolder 0.87253 0.14951 ViewTag 5.24257 0.46500 Wakelock 3.34665 0.72014 Downloads 50-100 0.62490 0.26245 100-500 0.64699 0.22494 500-1000 0.56768 0.23505 1000-5000 0.50707 0.22225 5000-10000 0.53432 0.22486 10000-50000 0.62449 0.21626 50000-100000 0.42214 0.23402 100000-500000 0.21479 0.25358 1000000-5000000 0.40593 0.21851 10000000-50000000 0.03474 0.61827 100000000-500000000 0.30693 0.39868 1000000000-5000000000 0.41522 0.61599 NA 0.03868 1.02076 Contributors 1.04996 0.01265 |
There is not a lot of difference in the coefficients for the number of downloads (the model fit is poor when the Standard error is close to the Coefficient value).
The paper Investigating Types and Survivability of Performance Bugs in Mobile Apps analyses a smaller dataset of performance issue lifetimes.
Recent Comments