Archive
Software engineering experiments: sell the idea, not the results
A new paper investigates “… the feasibility of stealthily introducing vulnerabilities in OSS via hypocrite commits (i.e., seemingly beneficial commits that in fact introduce other critical issues).” Their chosen Open source project was the Linux kernel, and they submitted three patches to the kernel review process.
This interesting idea blew up in their faces, when the kernel developers deduced that they were being experimented on (they obviously don’t have a friend on the inside). The authors have come out dodging and weaving.
What can be learned by reading the paper?
Firstly, three ‘hypocrite commits’ is not enough submissions to do any meaningful statistical analysis. I suspect it’s a convenience sample, a common occurrence in software engineering research. The authors sell three as a proof-of-concept.
How many of the submitted patches passed the kernel review process?
The paper does not say. The first eight pages provide an introduction to the Open source development model, the threat model for introducing vulnerabilities, and the characteristics of vulnerabilities that have been introduced (presumably by accident). This is followed by 2.5 pages of background and setup of the experiment (labelled as a proof-of-concept).
The paper then switches (section VII) to discussing a different, but related, topic: the lifetime of (unintended) vulnerabilities in patches that had been accepted (which I think should have been the topic of the paper. This interesting discussion is 1.5 pages; also see The life and death of statically detected vulnerabilities: An empirical study, covered in figure 6.9 in my book.
The last two pages discuss mitigation, related work, and conclusion (“…a proof-of-concept to safely demonstrate the practicality of hypocrite commits, and measured and quantified the risks.”; three submissions is not hard to measure and quantify, but the results are not to be found in the paper).
Having the paper provide the results (i.e., all three commits spotted, and a very negative response by those being experimented on) would have increased the chances of negative reviewer comments.
Over the past few years I have started noticing this kind of structure in software engineering papers, i.e., extended discussion of an interesting idea, setup of experiment, and cursory or no discussion of results. Many researchers are willing to spend lots of time discussing their ideas, but are unwilling to invest much time in the practicalities of testing them. Some reviewers (who decide whether a paper is accepted to publication) don’t see anything wrong with this approach, e.g., they accept these kinds of papers.
Software engineering research remains a culture of interesting ideas, with evidence being an optional add-on.
The impact of believability on reasoning performance
What are the processes involved in reasoning? While philosophers have been thinking about this question for several thousand years, psychologists have been running human reasoning experiments for less than a hundred years (things took off in the late 1960s with the Wason selection task).
Reasoning is a crucial ability for software developers, and I thought that there would be lots to learn from the cognitive psychologists research into reasoning. After buying all the books, and reading lots of papers, I realised that the subject was mostly convoluted rabbit holes individually constructed by tiny groups of researchers. The field of decision-making is where those psychologists interested in reasoning, and a connection to reality, hang-out.
Is there anything that can be learned from research into human reasoning (other than that different people appear to use different techniques, and some problems are more likely to involve particular techniques)?
A consistent result from experiments involving syllogistic reasoning is that subjects are more likely to agree that a conclusion they find believable follows from the premise (and are more likely to disagree with a conclusion they find unbelievable). The following is perhaps the most famous syllogism (the first two lines are known as the premise, and the last line is the conclusion):
    All men are mortal.
    Socrates is a man.
Therefore, Socrates is mortal. |
Would anybody other than a classically trained scholar consider that a form of logic invented by Aristotle provides a reasonable basis for evaluating reasoning performance?
Given the importance of reasoning ability in software development, there ought to be some selection pressure on those who regularly write software, e.g., software developers ought to give a higher percentage of correct answers to reasoning problems than the general population. If the selection pressure for reasoning ability is not that great, at least software developers have had a lot more experience solving this kind of problem, and practice should improve performance.
The subjects in most psychology experiments are psychology undergraduates studying in the department of the researcher running the experiment, i.e., not the general population. Psychology is a numerate discipline, or at least the components I have read up on have a numeric orientation, and I have met a fair few psychology researchers who are decent programmers. Psychology undergraduates must have an above general-population performance on syllogism problems, but better than professional developers? I don’t think so, but then I may be biased.
A study by Winiger, Singmann, and Kellen asked subjects to specify whether the conclusion of a syllogism was valid/invalid/don’t know. The syllogisms used were some combination of valid/invalid and believable/unbelievable; examples below:
        Believable                  Unbelievable
Valid
        No oaks are jubs.           No trees are punds.
        Some trees are jubs.        Some Oaks are punds.
        Therefore, some trees       Therefore, some oaks
                   are not oaks.               are not trees.
Invalid
        No tree are brops.          No oaks are foins.
        Some oaks are brops.        Some trees are foins.
        Therefore, some trees       Therefore, some oaks
are not oaks. are not trees. |
The experiment was run using an online crowdsource site, and 354 data sets were obtained.
The plot below shows the impact of conclusion believability (red)/unbelievability (blue/green) on subject performance, when deciding whether a syllogism was valid (left) or invalid (right), (code+data):
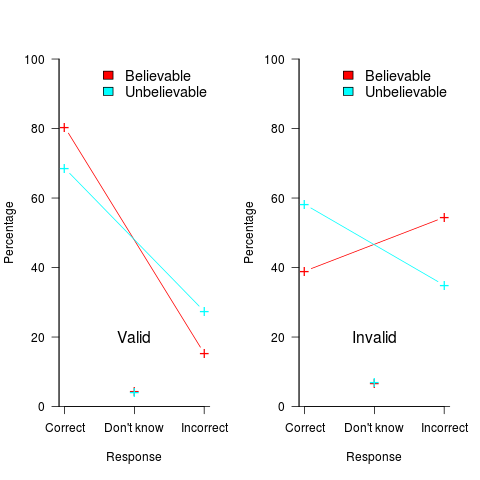
The believability of the conclusion biases the responses away/towards the correct answer (the error bars are tiny, and have not been plotted). Building a regression model puts numbers to the difference, and information on the kind of premise can also be included in the model.
Do professional developers exhibit such a large response bias (I would expect their average performance to be better)?
People tend to write fewer negative tests, than positive tests. Is this behavior related to the believability that certain negative events can occur?
Believability is an underappreciated coding issue.
Hopefully people will start doing experiments to investigate this issue 🙂
Payback time-frame for research in software engineering
What are the major questions in software engineering that researchers should be trying to answer?
A high level question whose answer is likely to involve life, the universe, and everything is: What is the most cost-effective way to build software systems?
Viewing software engineering research as an attempt to find the answer to a big question mirrors physicists quest for a Grand Unified Theory of how the Universe works.
Physicists have the luxury of studying the Universe at their own convenience, the Universe does not need their input to do a better job.
Software engineering is not like physics. Once a software system has been built, the resources have been invested, and there is no reason to recreate it using a more cost-effective approach (the zero cost of software duplication means that manufacturing cost is the cost of the first version).
Designing and researching new ways of building software systems may be great fun, but the time and money needed to run the realistic experiments needed to evaluate their effectiveness is such that they are unlikely to be run. Searching for more cost-effective software development techniques by paying to run the realistic experiments needed to evaluate them, and waiting for the results to become available, is going to be expensive and time-consuming. A theory is proposed, experiments are run, results are analysed; rinse and repeat until a good-enough cost-effective technique is found. One iteration will take many years, and this iterative process is likely to take many decades.
Very many software systems are being built and maintained, and each of these is an experiment. Data from these ‘experiments’ provides a cost-effective approach to improving existing software engineering practices by studying the existing practices to figure out how they work (or don’t work).
Given the volume of ongoing software development, most of the payback from any research investment is likely to occur in the near future, not decades from now; the evidence shows that source code has a short and lonely existence. Investing for a payback that might occur 30-years from now makes no sense; researchers I talk to often use this time-frame when I ask them about the benefits of their research, i.e., just before they are about to retire. Investing in software engineering research only makes economic sense when it is focused on questions that are expected to start providing payback in, say, 3-5 years.
Who is going to base their research on existing industry practices?
Researching existing practices often involves dealing with people issues, and many researchers in computing departments are not that interested in the people side of software engineering, or rather they are more interested in the computer side.
Algorithm oriented is how I would describe researchers who claim to be studying software engineering. I am frequently told about the potential for huge benefits from the discovery of more efficient algorithms. For many applications, algorithms are now commodities, i.e., they are good enough. Those with a career commitment to studying algorithms have a blinkered view of the likely benefits of their work (most of those I have seen are doing studying incremental improvements, and are very unlikely to make a major break through).
The number of researchers studying what professional developers do, with an aim to improving it, is very small (I am excluding the growing number of fake researchers doing surveys). While I hope there will be a significant growth in numbers, I’m not holding my breadth (at least in the short term; as for the long term, Planck’s experience with quantum mechanics was: “Science advances one funeral at a time”).
How should involved if-statement conditionals be structured?
Which of the following two if-statements do you think will be processed by readers in less time, and with fewer errors, when given the value of x, and asked to specify the output?
// First - sequence of subexpressions if (x > 0 && x < 10 || x > 20 && x < 30) print("a"); else print "b"); // Second - nested ifs if (x > 0 && x < 10) print("c"); else if (x > 20 && x < 30) print("d"); else print("e"); |
Ok, the behavior is not identical, in that the else if-arm produces different output than the preceding if-arm.
The paper Syntax, Predicates, Idioms — What Really Affects Code Complexity? analyses the results of an experiment that asked this question, including more deeply nested if-statements, the use of negation, and some for-statement questions (this post only considers the number of conditions/depth of nesting components). A total of 1,583 questions were answered by 220 professional developers, with 415 incorrect answers.
Based on the coefficients of regression models fitted to the results, subjects processed the nested form both faster and with fewer incorrect answers (code+data). As expected performance got slower, and more incorrect answers given, as the number of intervals in the if-condition increased (up to four in this experiment).
I think short-term memory is involved in this difference in performance; or at least I can concoct a theory that involves a capacity limited memory. Comprehending an expression (such as the conditional in an if-statement) requires maintaining information about the various components of the expression in working memory. When the first subexpression of x > 0 && x < 10 || x > 20 && x < 30 is false, and the subexpression after the || is processed, there is no now forget-what-went-before point like there is for the nested if-statements. I think that the single expression form is consuming more working memory than the nested form.
Does the result of this experiment (assuming it is replicated) mean that developers should be recommended to write sequences of conditions (e.g., the first if-statement example) about as:
if (x > 0 && x < 10) print("a"); else if (x > 20 && x < 30) print("a"); else print("b"); |
Duplicating code is not good, because both arms have to be kept in sync; ok, a function could be created, but this is extra effort. As other factors are taken into account, the costs of the nested form start to build up, is the benefit really worth the cost?
Answering this question is likely to need a lot of work, and it would be a more efficient use of resources to address questions about more commonly occurring conditions first.
A commonly occurring use is testing a single range; some of the ways of writing the range test include:
if (x > 0 && x < 10) ... if (0 < x && x < 10) ... if (10 > x && x > 0) ... if (x > 0 && 10 > x) ... |
Does one way of testing the range require less effort for readers to comprehend, and be more likely to be interpreted correctly?
There have been some experiments showing that people are more likely to give correct answers to questions involving information expressed as linear syllogisms, if the extremes are at the start/end of the sequence, such as in the following:
     A is better than B
B is better than C |
and not the following (which got the lowest percentage of correct answers):
     B is better than C
B is worse than A |
Your author ran an experiment to find out whether developers were more likely to give correct answers for particular forms of range tests in if-conditions.
Out of a total of 844 answers, 40 were answered incorrectly (roughly one per subject; it was a paper and pencil experiment, so no timings). It's good to see that the subjects were so competent, but with so few mistakes made the error bars are very wide, i.e., too few mistakes were made to be able to say that one representation was less mistake-prone than another.
I hope this post has got other researchers interested in understanding developer performance, when processing if-statements, and that they will be running more experiments help shed light on the processes involved.
An experiment involving matching regular expressions
Recommendations for/against particular programming constructs have one thing in common: there is no evidence backing up any of the recommendations. Running experiments to measure the impact of particular language features on developer performance is not something that researchers do (there have been a handful of experiments looking at the impact of strong typing on developer performance; the effect measured was tiny).
In February I discovered two groups researching regular expressions. In the first post on duplicate regexs, I promised to say something about the second group. This post discusses an experiment comparing developer comprehension of various regular expressions; the paper is: Exploring Regular Expression Comprehension.
The experiment involved 180 workers on Mechanical Turk (to be accepted, workers had to correctly answer four or five questions about regular expressions). Workers/subjects performed two different tasks, matching and composition.
- In the matching task workers saw a regex and a list of five strings, and had to specify whether the regex matched (or not) each string (there was also an unsure response).
- In the composition task workers saw a regular expression, and had to create a string matched by this regex. Each worker saw 10 different regexs, which were randomly drawn from a set of 60 regexs (which had been created to be representative of various regex characteristics). I have not analysed this data yet.
What were the results?
For the matching task: given each of the pairs of regexs below, which one (of each pair) would you say workers were most likely to get correct?
R1 R2 1. tri[a-f]3 tri[abcdef]3 2. no[w-z]5 no[wxyz]5 3. no[w-z]5 no(w|x|y|z)5 4. [ˆ0-9] [\D] |
The percentages correct for (1) were essentially the same, at 94.0 and 93.2 respectively. The percentages for (2) were 93.3 and 87.2, which is odd given that the regex is essentially the same as (1). Is this amount of variability in subject response to be expected? Is the difference caused by letters being much less common in text, so people have had less practice using them (sounds a bit far-fetched, but its all I could think of). The percentages for (3) are virtually identical, at 93.3 and 93.7.
The percentages for (4) were 58 and 73.3, which surprised me. But then I have been using regexs since before \D support was generally available. The MTurk generation have it easy not having to use the ‘hard stuff’ 😉
See Table III in the paper for more results.
This matching data might be analysed using Item Response theory, which can take into account differences in question difficulty and worker/subject ability. The plot below looks complicated, but only because there are so many lines. Each numbered colored line is a different regex, worker ability is on the x-axis (greater ability on the right), and the y-axis is the probability of giving a correct answer (code+data; thanks to Peipei Wang for fixing the bugs in my code):
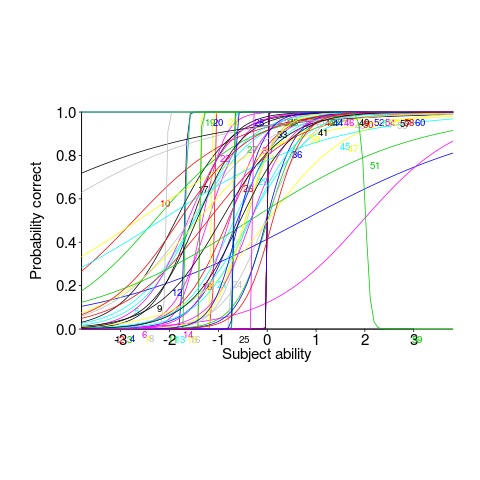
Yes, for question 51 the probability of a correct answer decreases with worker ability. Heads are being scratched about this.
There might be some patterns buried in amongst all those lines, e.g., particular kinds of patterns require a given level of ability to handle, or correct response to some patterns varying over the whole range of abilities. These are research questions, and this is a blog article: answers in the comments 🙂
This is the first experiment of its kind, so it is bound to throw up more questions than answers. Are more incorrect responses given for longer regexs, particularly if they cannot be completely held in short-term memory? It is convenient for the author to use a short-hand for a range of characters (e.g., a-f), and I was expecting a difference in performance when all the letters were enumerated (e.g., abcdef); I had theories for either one being less error-prone (I obviously need to get out more).
How useful are automatically generated compiler tests?
Over the last decade, testing compilers using automatically generated source code has been a popular research topic (for those working in the compiler field; Csmith kicked off this interest). Compilers are large complicated programs, and they will always contain mistakes that lead to faults being experienced. Previous posts of mine have raised two issues on the use of automatically generated tests: a financial issue (i.e., fixing reported faults costs money {most of the work on gcc and llvm is done by people working for large companies}, and is intended to benefit users not researchers seeking bragging rights for their latest paper), and applicability issue (i.e., human written code has particular characteristics and unless automatically generated code has very similar characteristics the mistakes it finds are unlikely to commonly occur in practice).
My claim that mistakes in compilers found by automatically generated code are unlikely to be the kind of mistakes that often lead to a fault in the compilation of human written code is based on the observations (I don’t have any experimental evidence): the characteristics of automatically generated source is very different from human written code (I know this from measurements of lots of code), and this difference results in parts of the compiler that are infrequently executed by human written code being more frequently executed (increasing the likelihood of a mistake being uncovered; an observation based on my years working on compilers).
An interesting new paper, Compiler Fuzzing: How Much Does It Matter?, investigated the extent to which fault experiences produced by automatically generated source are representative of fault experiences produced by human written code. The first author of the paper, Michaël Marcozzi, gave a talk about this work at the Papers We Love workshop last Sunday (videos available).
The question was attacked head on. The researchers instrumented the code in the LLVM compiler that was modified to fix 45 reported faults (27 from four fuzzing tools, 10 from human written code, and 8 from a formal verifier); the following is an example of instrumented code:
warn ("Fixing patch reached"); if (Not.isPowerOf2()) { if (!(C-> getValue().isPowerOf2() // Check needed to fix fault && Not != C->getValue())) { warn("Fault possibly triggered"); } else { /* CODE TRANSFORMATION */ } } // Original, unfixed code |
The instrumented compiler was used to build 309 Debian packages (around 10 million lines of C/C++). The output from the builds were (possibly miscompiled) built versions of the packages, and log files (from which information could be extracted on the number of times the fixing patches were reached, and the number of cases where the check needed to fix the fault was triggered).
Each built package was then checked using its respective test suite; a package built from miscompiled code may successfully pass its test suite.
A bitwise compare was run on the program executables generated by the unfixed and fixed compilers.
The following (taken from Marcozzi’s slides) shows the percentage of packages where the fixing patch was reached during the build, the percentages of packages where code added to fix a fault was triggered, the percentage where a different binary was generated, and the percentages of packages where a failure was detected when running each package’s tests (0.01% is one failure):
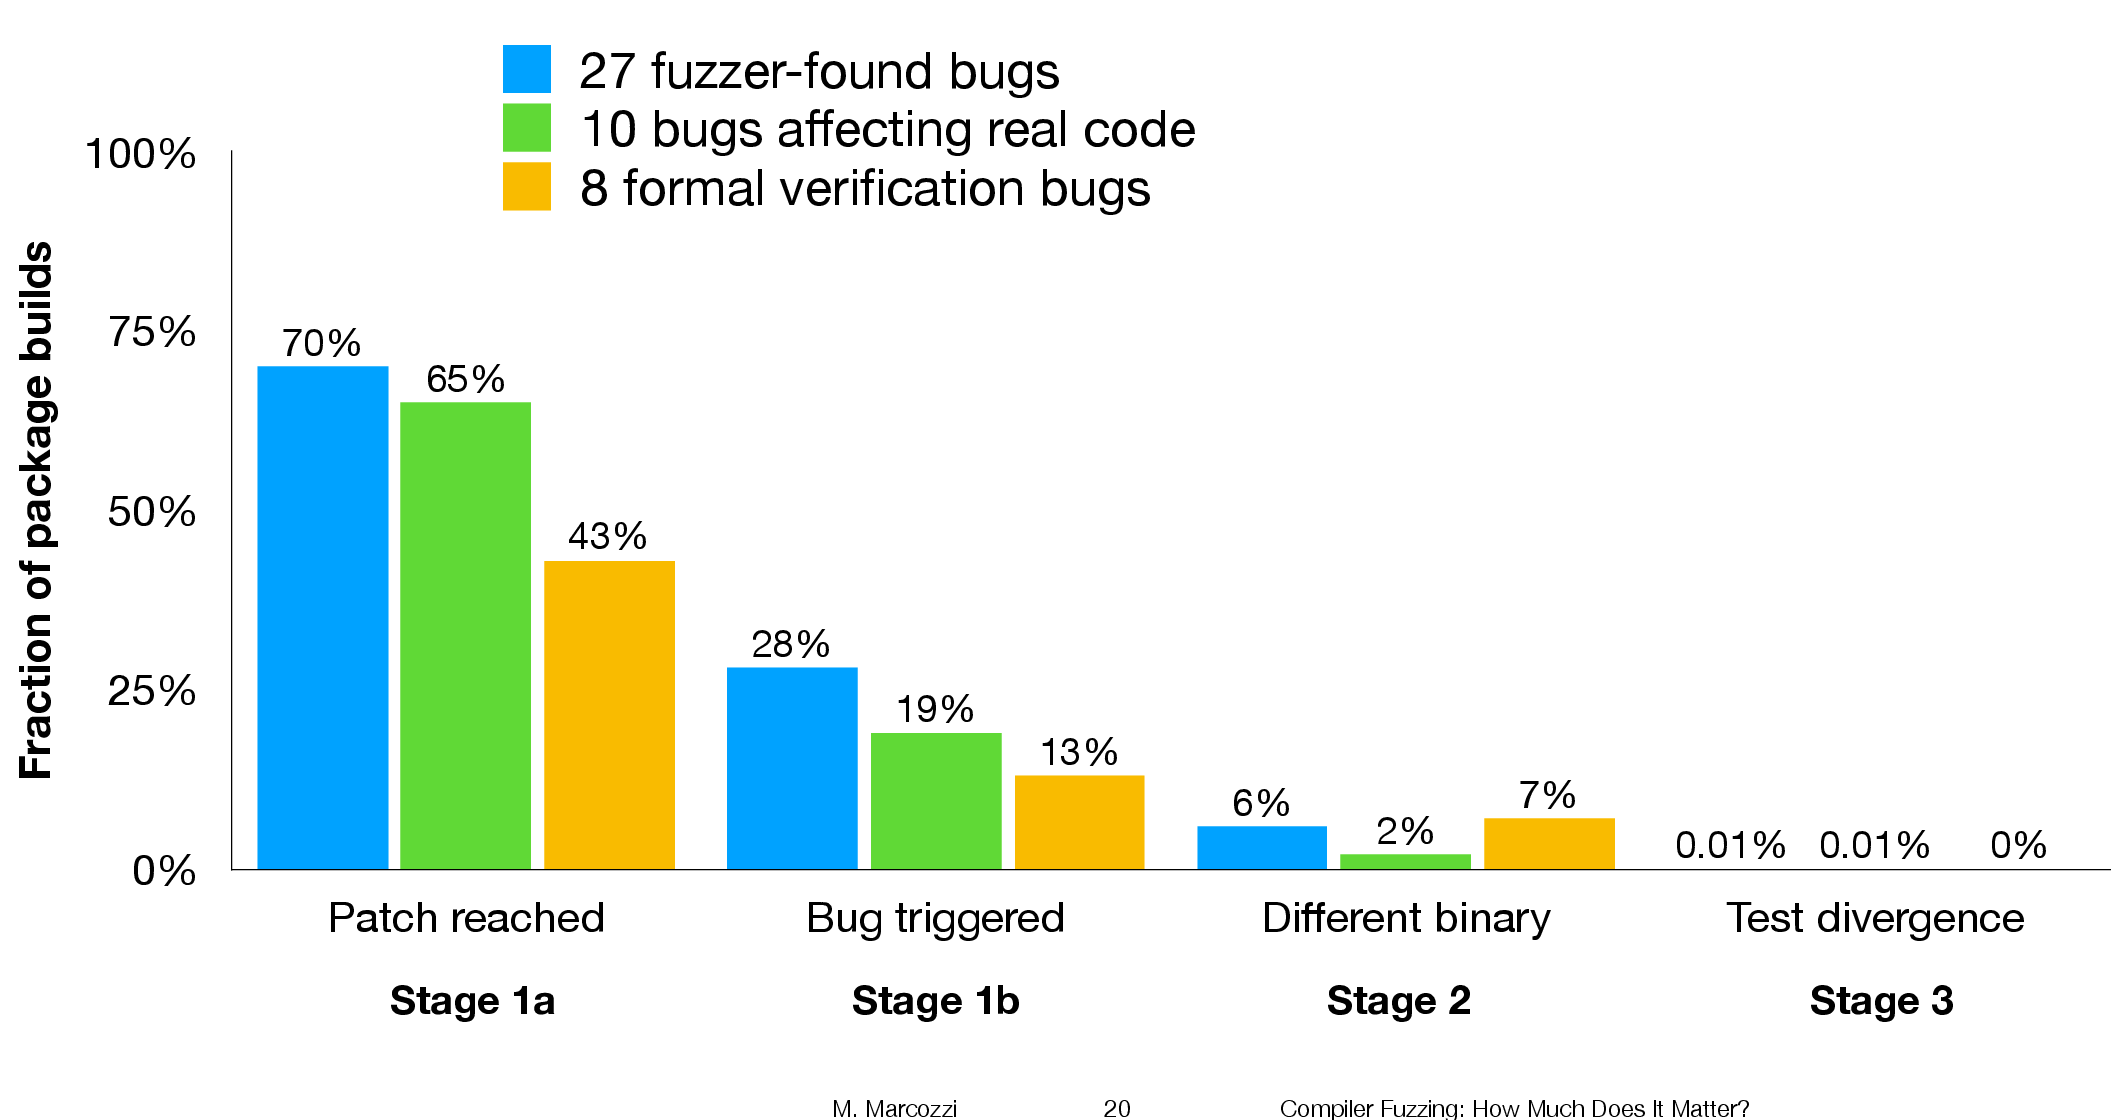
The takeaway from the above figure is that many packages are affected by the coding mistakes that have been fixed, but that most package test suites are not affected by the miscompilations.
To find out whether there is a difference, in terms of impact on Debian packages, between faults reported in human and automatically generated code, we need to compare the number of occurrences of “Fault possibly triggered”. The table below shows the break-down by the detector of the coding mistake (i.e., Human and each of the automated tools used), and the number of fixed faults they contributed to the analysis.
Human, Csmith and EMI each contributed 10-faults to the analysis. The fixes for the 10-fault reports in human generated code were triggered 593 times when building the 309 Debian packages, while each of the 10 Csmith and EMI fixes were triggered 1,043 and 948 times respectively; a lot more than the Human triggers :-O. There are also a lot more bitwise compare differences for the non-Human fault-fixes.
Detector Faults Reached Triggered Bitwise-diff Tests failed Human 10 1,990 593 56 1 Csmith 10 2,482 1,043 318 0 EMI 10 2,424 948 151 1 Orange 5 293 35 8 0 yarpgen 2 608 257 0 0 Alive 8 1,059 327 172 0 |
Is the difference due to a few packages being very different from the rest?
The table below breaks things down by each of the 10-reported faults from the three Detectors.
Ok, two Human fault-fix locations are never reached when compiling the Debian packages (which is a bit odd), but when the locations are reached they are just not triggering the fault conditions as often as the automatic cases.
Detector   Reached    Triggered
Human
              300       278
              301         0
              305         0
                0         0
                0         0
              133        44
              286       231
              229         0
              259        40
               77         0
Csmith
              306         2
              301       118
              297       291
              284         1
              143         6
              291       286
              125       125
              245         3
              285        16
              205       205
EMI
              130         0
              307       221
              302       195
              281        32
              175         5
              122         0
              300       295
              297       215
              306       191
287 10 |
It looks like I am not only wrong, but that fault experiences from automatically generated source are more (not less) likely to occur in human written code (than fault experiences produced by human written code).
This is odd. At best, I would expect fault experiences from human and automatically generated code to have the same characteristics.
Ideas and suggestions welcome.
Update: the morning after
I have untangled my thoughts on how to statistically compare the three sets of data.
The bootstrap is based on the idea of exchangeability; which items being measured might we consider to be exchangeable, i.e., being able to treat the measurement of one as being the equivalent to measuring the other.
In this experiment, the coding mistakes are not exchangeable, i.e., different mistakes can have different outcomes.
But we might claim that the detection of mistakes is exchangeable; that is, a coding mistake is just as likely to be detected by source code produced by an automatic tool as source written by a Human.
The bootstrap needs to be applied without replacement, i.e., each coding mistake is treated as being unique. The results show that for the sum of the Triggered counts (code+data):
- treating Human and Csmith as being equally likely to detect the same coding mistake, there is a 18% change of the Human results being lower than 593.
- treating Human and EMI as being equally likely to detect the same coding mistake, there is a 12% change of the Human results being lower than 593.
So the likelihood of the lower value, 593, of Human Triggered events is expected to occur quite often (i.e., 12% and 18%). Automatically generated code is not more likely to detect coding mistakes than human written code (at least based on this small sample set).
Three books discuss three small data sets
During the early years of a new field, experimental data relating to important topics can be very thin on the ground. Ever since the first computer was built, there has been a lot of data on the characteristics of the hardware. Data on the characteristics of software, and the people who write it, has been (and often continues to be) very thin on the ground.
Books are sometimes written by the researchers who produce the first data associated with an important topic, even if the data set is tiny; being first often generates enough interest for a book length treatment to be considered worthwhile.
As a field progresses lots more data becomes available, and the discussion in subsequent books can be based on findings from more experiments and lots more data
Software engineering is a field where a few ‘first’ data books have been published, followed by silence, or rather lots of arm waving and little new data. The fall of Rome has been followed by a 40-year dark-age, from which we are slowly emerging.
Three of these ‘first’ data books are:
- “Man-Computer Problem Solving” by Harold Sackman, published in 1970, relating to experimental data from 1966. The experiments investigated the impact of two different approaches to developing software, on programmer performance (i.e., batch processing vs. on-line development; code+data). The first paper on this work appeared in an obscure journal in 1967, and was followed in the same issue by a critique pointing out the wide margin of uncertainty in the measurements (the critique agreed that running such experiments was a laudable goal).
Failing to deal with experimental uncertainty is nothing compared to what happened next. A 1968 paper in a widely read journal, the Communications of the ACM, contained the following table (extracted from a higher quality scan of a 1966 report by the same authors, and available online).
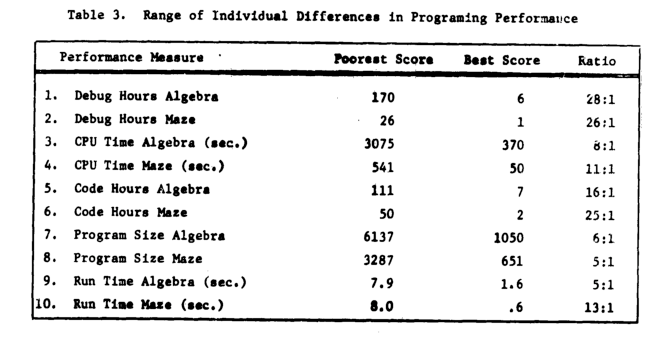
The tale of 1:28 ratio of programmer performance, found in an experiment by Grant/Sackman, took off (the technical detail that a lot of the difference was down to the techniques subjects’ used, and not the people themselves, got lost). The Grant/Sackman ‘finding’ used to be frequently quoted in some circles (or at least it did when I moved in them, I don’t know often it is cited today). In 1999, Lutz Prechelt wrote an expose on the sorry tale.
Sackman’s book is very readable, and contains lots of details and data not present in the papers, including survey data and a discussion of the intrinsic uncertainties associated with the experiment; it also contains the table above.
- “Software Engineering Economics” by Barry W. Boehm, published in 1981. I wrote about the poor analysis of the data contained in this book a few years ago.
The rest of this book contains plenty of interesting material, and even sounds modern (because books moving the topic forward have not been written).
- “Program Evolution: Process of Software Change” edited by M. M. Lehman and L. A. Belady, published in 1985, relating to experimental data from 1977 and before. Lehman and Belady managed to obtain data relating to 19 releases of an IBM software product (yes, 19, not nineteen-thousand); the data was primarily the date and number of modules contained in each release, plus less specific information about number of statements. This data was sliced and diced every which way, and the book contains many papers with the same data appearing in the same plot with different captions (had the book not been a collection of papers it would have been considerably shorter).
With a lot less data than Isaac Newton had available to formulate his three laws, Lehman and Belady came up with five, six, seven… “laws of software evolution” (which themselves evolved with the publication of successive papers).
The availability of Open source repositories means there is now a lot more software system evolution data available. Lehman’s laws have not stood the test of more data, although people still cite them every now and again.
How much is a 1-hour investment today worth a year from now?
Today, I am thinking of investing 1-hour of effort adding more comments to my code; how much time must this investment save me X-months from now, for today’s 1-hour investment to be worthwhile?
Obviously, I must save at least 1-hour. But, the purpose of making an investment is to receive a greater amount at a later time; ‘paying’ 1-hour to get back 1-hour is a poor investment (unless I have nothing else to do today, and I’m likely to be busy in the coming months).
The usual economic’s based answer is based on compound interest, the technique your bank uses to calculate how much you owe them (or perhaps they owe you), i.e., the expected future value grows exponentially at some interest rate.
Psychologists were surprised to find that people don’t estimate future value the way economists do. Hyperbolic discounting provides a good match to the data from experiments that asked subjects to value future payoffs. The form of the equation used by economists is:  , while hyperbolic discounting has the form
  , where:
  is a constant, and
  the period of time.
The simple economic approach does not explicitly include the risk that one of the parties involved may cease to exist. Including risk is non-trivial, banks handle the risk that you might disappear by asking for collateral, or adding something to the interest rate charged.
The fact that humans, and some other animals, have been found to use hyperbolic discounting suggests that evolution has found this approach, to discounting time, increases the likelihood of genes being passed on to the next generation. A bird in the hand is worth two in the bush.
How do software developers discount investment in software engineering projects?
The paper Temporal Discounting in Technical Debt: How do Software Practitioners Discount the Future? describes a study that specifies a decision that has to be made and two options, as follows:
“You are managing an N-years project. You are ahead of schedule in the current iteration. You have to decide between two options on how to spend our upcoming week. Fill in the blank to indicate the least amount of time that would make you prefer Option 2 over Option 1.
- Option 1: Implement a feature that is in the project backlog, scheduled for the next iteration. (five person days of effort).
- Option 2: Integrate a new library (five person days effort) that adds no new functionality but has a 60% chance of saving you person days of effort over the duration of the project (with a 40% chance that the library will not result in those savings).
”
Subjects are then asked six questions, each having the following form (for various time frames):
“For a project time frame of 1 year, what is the smallest number of days that would make you prefer Option 2? ___”
The experiment is run twice, using professional developers from two companies, C1 and C2 (23 and 10 subjects, respectively), and the data is available for download 🙂
The following plot shows normalised values given by some of the subjects from company C1, for the various time periods used (y-axis shows  ). On a log scale, values estimated using the economists exponential approach would form a straight line (e.g., close to the first five points of subject M, bottom right), and values estimated using the hyperbolic approach would have the concave form seen for subject C (top middle) (code+data).
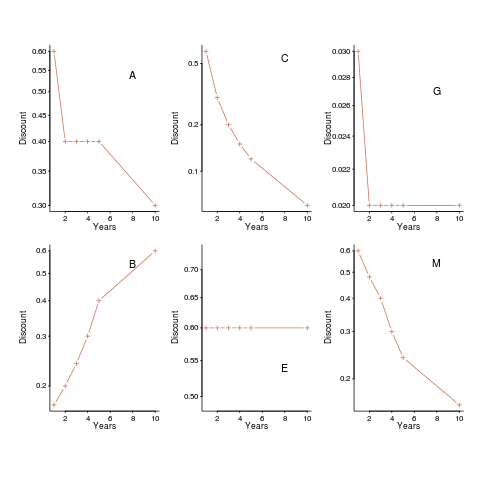
Subject B is asking for less, not more, over a longer time period (several other subjects have the same pattern of response). Why did Subject E (and most of subject G’s responses) not vary with time? Perhaps they were tired and were not willing to think hard about the problem, or perhaps they did not think the answer made much difference. The subjects from company C2 showed a greater amount of variety. Company C1 had some involvement with financial applications, while company C2 was involved in simulations. Did this domain knowledge spill over into company C1’s developers being more likely to give roughly consistent answers?
The experiment was run online, rather than an experimenter being in the room with subjects. It is possible that subjects would have invested more effort if a more formal setting, with an experimenter who had made the effort to be present. Also, if an experimenter had been present, it would have been possible to ask question to clarify any issues.
Both exponential and hyperbolic equations can be fitted to the data, but given the diversity of answers, it is difficult to put any weight in either regression model. Some subjects clearly gave responses fitting a hyperbolic equation, while others gave responses fitted approximately well by either approach, and other subjects used. It was possible to fit the combined data from all of company C1 subjects to a single hyperbolic equation model (the most significant between subject variation was the value of the intercept); no such luck with the data from company C2.
I’m very please to see there has been a replication of this study, but the current version of the paper is a jumble of ideas, and is thin on experimental procedure. I’m sure it will improve.
What do we learn from this study? Perhaps that developers need to learn something about calculating expected future payoffs.
Modular vs. monolithic programs: a big performance difference
For a long time now I have been telling people that no experiment has found a situation where the treatment (e.g., use of a technique or tool) produces a performance difference that is larger than the performance difference between the subjects.
The usual results are that differences between people is the source of the largest performance difference, successive runs are the next largest (i.e., people get better with practice), and the smallest performance difference occurs between using/not using the technique or tool.
This is rather disheartening news.
While rummaging through a pile of books I had not looked at in many years, I (re)discovered the paper “An empirical study of the effects of modularity on program modifiability” by Korson and Vaishnavi, in “Empirical Studies of Programmers” (the first one in the series). It’s based on Korson’s 1988 PhD thesis, with the same title.
There were four experiments, involving seven people from industry and nine students, each involving modifying a 900(ish)-line program in some way. There were two versions of each program, they differed in that one was written in a modular form, while the other was monolithic. Subjects were permuted between various combinations of program version/problem, but all problems were solved in the same order.
The performance data (time to complete the task) was published in the paper, so I fitted various regressions models to it (code+data). There is enough information in the data to separate out the effects of modular/monolithic, kind of problem and subject differences. Because all subjects solved problems in the same order, it is not possible to extract the impact of learning on performance.
The modular/monolithic performance difference was around twice as large as the difference between subjects (removing two very poorly performing subjects reduces the difference to 1.5). I’m going to have to change my slides.
Would the performance difference have been so large if all the subjects had been experienced developers? There is not a lot of well written modular code out there, and so experienced developers get lots of practice with spaghetti code. But, even if the performance difference is of the same order as the difference between developers, that is still a very worthwhile difference.
Now there are lots of ways to write a program in modular form, and we don’t know what kind of job Korson did in creating, or locating, his modular programs.
There are also lots of ways of writing a monolithic program, some of them might be easy to modify, others a tangled mess. Were these programs intentionally written as spaghetti code, or was some effort put into making them easy to modify?
The good news from the Korson study is that there appears to be a technique that delivers larger performance improvements than the difference between people (replication needed). We can quibble over how modular a modular program needs to be, and how spaghetti-like a monolithic program has to be.
Performance impact of comments on tasks taking a few minutes
How cost-effective is an investment in commenting code?
Answering this question requires knowing the time needed to write the comment and the time they save for later readers of the code.
A recent study investigated the impact of comments in small programming tasks on developer performance, and Sebastian Nielebock, the first author, kindly sent me a copy of the data.
How might the performance impact of comments be measured?
The obvious answer is to ask subjects to solve a coding problem, with half the subjects working with code containing comments and the other half the same code without the comments. This study used three kinds of commenting: No comments, Implementation comments and Documentation comments; the source was in Java.
Were the comments in the experiment useful, in the sense of providing information that was likely to save readers some time? A preliminary run was used to check that the comments provided some benefit.
The experiment was designed to be short enough that most subjects could complete it in less than an hour (average time to complete all tasks was 31 minutes). My own experience with running experiments is that it is possible to get professional developers to donate an hour of their time.
What is a realistic and experimentally useful amount of work to ask developers to in an hour?
The authors asked subjects to complete 9-tasks; three each of applying the code (i.e., use the code’s API), fix a bug in the code, and extend the code. Would a longer version of one of each, rather than a shorter three of each been better? I think the only way to find out is to try it both ways (I hope the authors plan to do another version).
What were the results (code+data)?
Regular readers will know, from other posts discussing experiments, that the biggest factor is likely to be subject (professional developers+students) differences, and this is true here.
Based on a fitted regression model, Documentation comments slowed performance on a task by 30 seconds, compared to No comments and Implementation comments (which both had the same performance impact). Given that average task completion time was 205 seconds, this is a 15% slowdown for Documentation comments.
This study set out to measure the performance impact of comments on small programming tasks. The answer, at least for tasks designed to take a few minutes, is that No comments, or if comments are required, then write Implementation comments.
This experiment measured the performance impact of comments on developers who did not write the code containing them. These developers have to first read and understand the comments (which takes time). However, the evidence suggests that code is mostly modified by the developer who wrote it (just reading the code does not leave a record that can be analysed). In this case, the reading a comment (that the developer previously wrote) can trigger existing memories, i.e., it has a greater information content for the original author.
Will comments have a bigger impact when read by the person who wrote them (and the code), or on tasks taking more than a few minutes? I await the results of more experiments…
Update: I have updated the script based on feedback about the data from Sebastian Nielebock.