Archive
Citation patterns in my two books
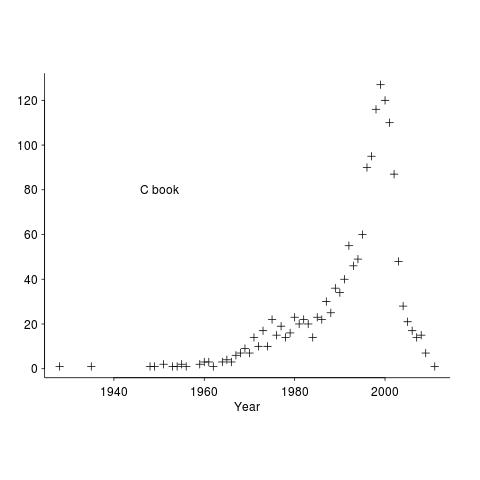
When writing my C book, I cited any paper or book whose material I made use of and/or that I thought would be useful to the reader. One of the rules for academic papers is to cite the paper that ‘invented’ the idea; this is intended to incentivize researchers to work hard to discover new things that will be cited many times (citation count is a measure of the importance of the work and these days a metric used when deciding promotions and awarding grants).
When I started writing the C book the premier search engine was AltaVista, with Google becoming number one a few years before the book was completed. Finding papers online was still a wondrous experience and Citeseer was a godsend.
The plot below shows the numbers of works cited by year of publication, for the C book.
These days all the information we could possible need is said to be online. I don’t think this is true, but it might be a good enough approximation. But being online does not mean being available for free, a lot of academic papers remain behind paywalls.
It used to be possible to visit a good University library and copy papers of interest (I have a filing cabinet full of paper from the C book). Those days are gone, with libraries moving their reference stock off-site (the better ones offer on-premise online access).
My book on empirical software engineering is driven by what data is available, which means most cited work is going to be relatively new. There is another big factor driving the work I cite this time around; I am fed up with tax payer funded research ending up behind paywalls, so I am only citing papers that can be downloaded for free (in practice they also have to be found by a search engine or linked to from somewhere or other) and when the ‘discovery’ paper is not available for download I cite a later work that is.
The plot below shows the numbers of works cited by year of publication, for the empirical software engineering draft book.
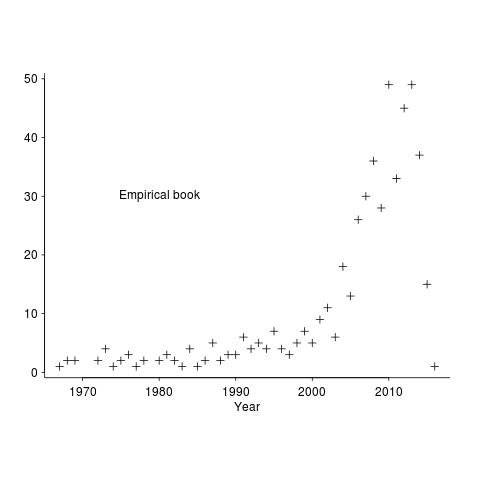
The rising slope is much sharper for the latest book. I think most of the difference is driven by the newness of the subject, software researchers tend to be very good (at least the non-business department ones) at making pdfs available for download.
Another factor might be how Citeseer and Google Scholar cross reference papers; Citeseer links to works cited by a paper (i.e., link back in time), while Google Scholar links to works that cite the paper (i.e., link forward in time).
Workshop on analyzing software engineering data
I am teaching a workshop, analyzing software engineering data, on 16 January 2016. If you meet the assumed level of know-how (basic understanding of maths to GCSE level, fluent in at least one programming language {i.e., written 10k+ lines of code} and will turn up with a laptop that has R installed), then you are welcome to sign up, its free. The event is being organized by ACCU London.
The focus is on extracting information that is useful to practicing software developers for creating software systems; statistics is used as a tool to find patterns in the data (R is used for this and the programs have the form: read_data(); format_data(); appropriate_statistical_function(); plot_results() and are usually contained in 10-30 lines).
The maths/programming requirements are there because the focus is on the software engineering ideas implied by the data; people need to implicitly understand how an equation fits together (not because there will be lots of algebra, there isn’t) and to be able to pick up and use a new language quickly.
The material is based on a book I am working on.
Its a hands-on workshop, with me talking for an hour or so and then everybody analyzing data for an hour, repeating until end-of-day. I have plenty of data for you to work on, but if you do have some software engineering data that you are willing to share with everybody, please bring it along.
The workshop is something of an experiment; as far as I know there are no books or courses aimed at software developers interested in analyzing software engineering data (there are a few books containing an assortment of academic papers). If the material is too easy I can speed up, if it is too hard then I will slow down; if the material is of no practical use we can all leave early.
The plan is to start at the beginning and cover all the important topics in software engineering. Obviously this requires more than a one day workshop. If there is enough interest there will be more workshops covering different topics (assuming I have time to organize the material and an available venue permitting).
Extracting the original data from a heatmap image
The paper Analysis of the Linux Kernel Evolution Using Code Clone Coverage analysed 136 versions of Linux (from 1.0 to 2.6.18.3) and calculated the amount of source code that was shared, going forward, between each pair of these versions. When I saw the heatmap at the end of the paper (see below) I knew it had to appear in my book. The paper was published in 2007 and I knew from experience that the probability of seven year old data still being available was small, but looked so interesting I had to try. I emailed the authors (Simone Livieri, Yoshiki Higo, Makoto Matsushita and Katsuro Inoue) and received a reply from Makoto Matsushita saying that he had searched for the data and had been able to find the original images created for the paper, which he kindly sent me.
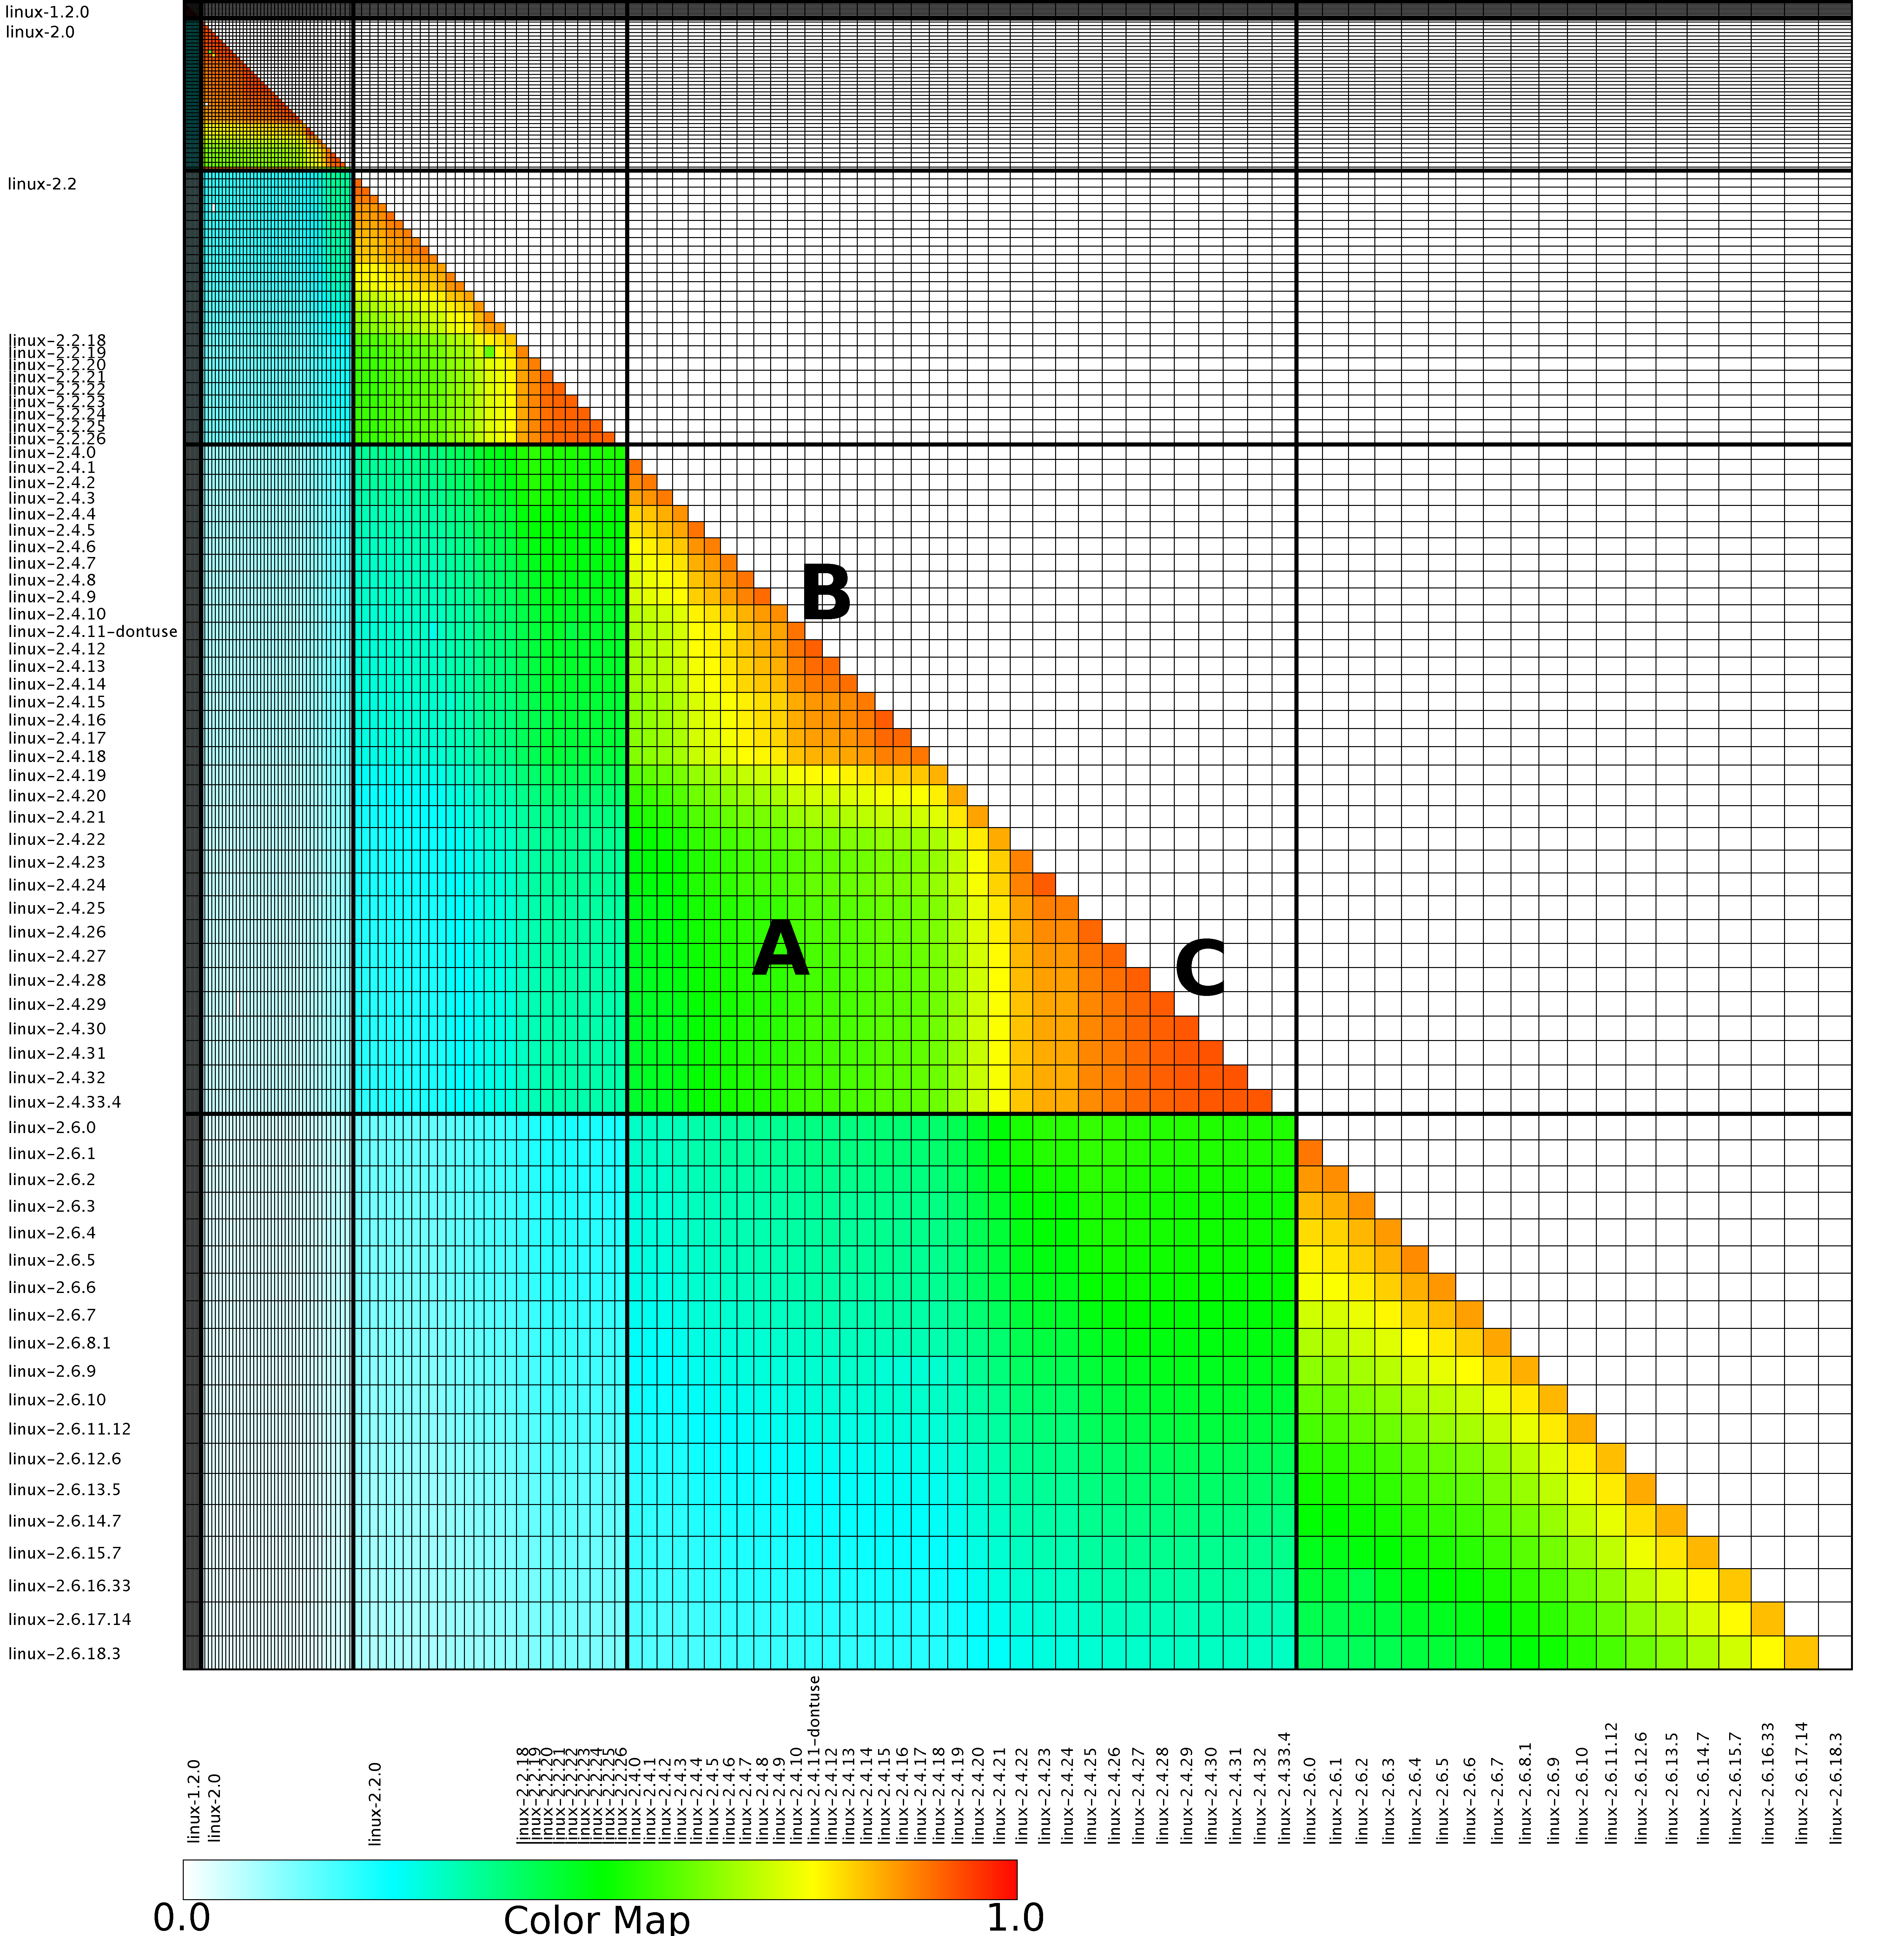
I was confident that I could reverse engineer the original values from the png image and that is what I have just done (I have previously reverse engineered the points in a pdf plot by interpreting the pdf commands to figure out relative page locations).
The idea I had was to find the x/y coordinates of the edge of the staircase running from top left to bottom right. Those black lines appear to complicate things, but the RGB representation of black follows the same pattern as white, i.e., all three components are equal (0 for black and 1 for white). All I had to do was locate the first pixel containing an RGB value whose three components had at least one different value, which proved to be remarkably easy to do using R’s vector operations.
After reducing duplicate sequences to a single item I now had the x/y coordinates of the colored rectangle for each version pair; extracting an RGB value for each pair of Linux releases was one R statement. Now I needed to map RGB values to the zero to one scale denoting the amount of shared Linux source. The color scale under the heatmap contains the information needed and with some trial and error I isolated a vector of RGB pixels from this scale. Passing the offset of each RGB value on this scale to mapvalues (in the plyr package) converted the extracted RGB values.
The extracted array has 130 rows/columns, which means information on 5 versions has been lost (no history is given for the last version). At the moment I am not too bothered, most of the data has been extracted.
Here is the result of calling the R function readPNG (from the png package) to read the original file, mapping the created array of RGB values to amount of Linux source in each version pair and calling the function image to display this array (I have gone for maximum color impact; the code has no for loops):
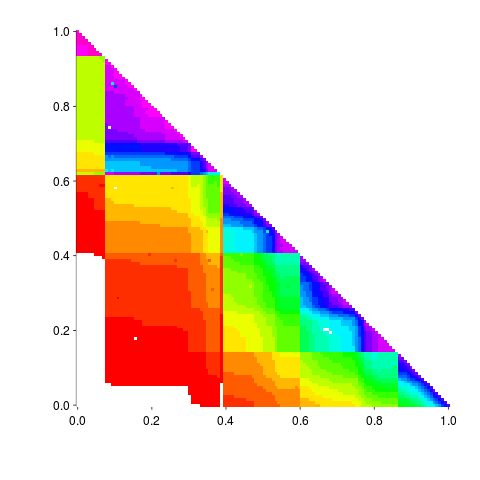
The original varied the width of the staircase, perhaps by some measure of the amount of source code. I have not done that.
Its suspicious that the letter A is not visible in some form. Its embedded in the original data and I would have expected a couple of hits on that black outline.
The above overview has not bored the reader with my stupidities that occurred along the way.
If you improve the code to handle other heatmap data extraction problems, please share the code.
A book about some important bits of R
I see that Hadley Wickham’s new book, “Advanced R”, is being published in dead tree form and will be available a month or so. Hadley has generously made the material available online; I quickly skimmed the material a few months ago when I first heard about it and had another skim this afternoon.
The main problem with the book is its title, authors are not supposed to write advanced books and then call them advanced. When I studied physics the books all had “advanced” in their titles, but when I got to University the books switched to having some variant of “fundamental” in their title. A similar pattern applies to computer books, with the books aimed at people who know a bit and want to learn a bit more having an advanced-like word in their title and the true advanced stuff having more downbeat titles, e.g., Javascript: The Good Parts, “Algorithms in Snobol 4”, Algorithms + Data Structures = Programs.
Some alternative title suggestions: “R: Some important bits”, “The Anatomy of R” or “The nitty gritty of R”.
The book is full of useful technical details that are scattered about and time consuming to find elsewhere; a useful reference manual, covering how to do technical stuff in R, to have on the shelf.
My main quibble with the book is the amount of airplay that the term “functional programming” gets. Does anybody really care that R has a strong functional flavor? Would many R users recognize another functional language if it jumped up and bit them? The die hard functional folk would probably say that R is not really a functional language, but who cares. I think people who write about R should stop using the words “functional programming”, it just confuses R users and serves no useful purpose; just talk about the convenient things that R allows us to write.
A book that I would really like to read is the R equivalent of books such as “Algorithms in Snobol 4”, “Effective C++” and “SQL for Smarties” (ok, that one has advanced in the subtitle), that take a wide selection of relatively simple problems and solve them in ways that highlight different aspects of the language (perhaps providing multiple solutions to the same problem).
How to use intellectual property tax rules to minimise corporation tax
I recently bought the book Valuing Intellectual Capital by Gio Wiederhold because I thought it might provide some useful information for a book I am working on. A better title for the book might have been “How to use intellectual property tax rules to minimise corporation tax”, not what I was after but a very interesting read none the less.
If you run a high-tech company that operates internationally, don’t know anything about finance, and want to learn about the various schemes that can be used to minimise the tax your company pays to Uncle Sam this book is for you.
This book is also an indispensable resource for anybody trying to unravel the financial structure of an international company.
On the surface this book is a detailed and readable how-to on using IP tax rules to significantly reduce the total amount of corporation tax an international company pay on their profits, but its real message is the extent to which companies have to distort their business and engage in ‘unproductive’ activities to achieve this goal.
Existing tax rules are spaghetti code and we all know how much effect tweaking has on this kind of code. Gio Wiederhold’s recommended rewrite (chapter 10) is the ultimate in simplicity: set corporation tax to zero (the government will get its cut by taxing the dividends paid out to shareholders).
Software developers will appreciate the “here’s how to follow the rules to achieve this effect” approach; this book could also be read as an example of how to write good software documentation.
Ordinary Least Squares is dead to me
Most books that discuss regression modeling start out and often finish with Ordinary Least Squares (OLS) as the technique to use; Generalized Linear ModelLeast Squares (GLMS) sometimes get a mention near the back. This is all well and good if the readers’ data has the characteristics required for OLS to be an applicable technique. A lot of data in the social sciences has these characteristics, or so I’m told; lots of statistics books are written for social science students, as a visit to a bookshop will confirm.
Software engineering datasets often range over several orders of magnitude or involve low value count data, not the kind of data that is ideally suited for analysis using OLS. For this kind of data GLMS is probably the correct technique to use (the difference in the curves fitted by both techniques is often small enough to be ignored for many practical problems, but the confidence bounds and p-values often differ in important ways).
The target audience for my book, Empirical Software Engineering with R, are working software developers who have better things to do that learn lots of statistics. However, there is no getting away from the fact that I am going to have to make extensive use of GLMS, which means having to teach readers about the differences between OLS and GLMS and under what circumstances OLS is applicable. What a pain.
Then I had a brainwave, or a moment of madness (time will tell). Why bother covering OLS? Why not tell readers to always use GLMS, or rather use the R function that implements it, glm. The default glm behavior is equivalent to lm (the R function that implements OLS); the calculation is not being done by hand but by a computer (i.e., who cares if it is more complicated).
Perhaps there is an easy way to explain this to software developers: glm is the generic template that can handle everything and lm is a specialized template that is tuned to handle certain kinds of data (the exact technical term will need tweaking for different languages).
There is one user interface issue, models built using glm do not come with an easy to understand goodness of fit number (lm has the R-squared value). AIC is good for comparing models but as a single (unbounded) number it is not that helpful for the uninitiated. Will the demand for R-squared be such that I will be forced for tell readers about lm? We will see.
How do I explain the fact that so many statistics books concentrate on OLS and often don’t mention GLMS? Hey, they are for social scientists, software engineering data requires more sophisticated techniques. I will have to be careful with this answer as it plays on software engineers’ somewhat jaded views of social scientists (some of whom have made very major contribution to CRAN).
All the software engineering data I have seen is small enough that the performance difference between glm/lm is not a problem. If performance is a real issue then readers will search the net and find out about lm; sorry guys but I want to minimise what the majority of readers need to know.
Prioritizing project stakeholders using social network metrics
Identifying project stakeholders and their requirements is a very important factor in the success of any project. Existing techniques tend to be very ad-hoc. In her PhD thesis Soo Ling Lim came up with a very interesting solution using social network analysis and what is more made her raw data available for download 🙂
I have analysed some of Soo Ling’s data below as another draft section from my book Empirical software engineering with R. As always comments and pointers to more data welcome. R code and data here.
A more detailed discussion and analysis is available in Soo Ling Lim’s thesis, which is very readable. Thanks to Soo Ling for answering my questions about her work.
Stakeholder roles and individuals
A stakeholder is a person who has an interest in what an application does. In a well organised development project the influential stakeholders are consulted before any contracts or budgets are agreed. Failure to identify the important stakeholders can result in missing or poorly prioritized requirements which can have a significant impact on the successful outcome of a project.
While many people might consider themselves to be stakeholders whose opinions should be considered, in practice the following groups are the most likely to have their opinions taken into account:
- people having an influence on project funding,
- customers, i.e., those people who are willing pay to use or obtain a copy of the application,
- domain experts, i.e., people with experience in the subject area who might suggest better ways to do something or problems to try and avoid,
- people who have influence over the success or failure over the actual implementation effort, e.g., software developers and business policy makers,
- end-users of the application (who on large projects are often far removed from those paying for it).
In the case of volunteer open source projects the only people having any influence are those willing to do the work. On open source projects made up of paid contributors and volunteers the situation is likely to be complicated.
Individuals have influence via the roles they have within the domain addressed by an application. For instance, the specification of a security card access system is of interest to the role of ‘being in charge of the library’ because the person holding that role needs to control access to various facilities provided within different parts of the library, while the role of ‘student representative’ might be interested in the privacy aspects of the information held by the application and the role of ‘criminal’ has an interest in how easy it is to circumvent the access control measures.
If an application is used by large numbers of people there are likely to be many stakeholders and roles, identifying all these and prioritizing them has, from experience, been found to be time consuming and difficult. Once stakeholders have been identified they then need to be persuaded to invest time learning about the proposed application and to provide their own views.
The RALIC study
A study by Lim <book Lim_10> was based on a University College London (UCL) project to combine different access control mechanisms into one, such as access to the library and fitness centre. The Replacement Access, Library and ID Card (RALIC) project had more than 60 stakeholders and 30,000 users, and has been deployed at UCL since 2007, two years before the study started. Lim created the StakeNet project with the aim of to identifying and prioritising stakeholders.
Because the RALIC project had been completed Lim had access to complete project documentation from start to finish. This documentation, along with interviews of those involved, were used to create what Lim called the Ground truth of project stakeholder role priority, stakeholder identification (85 people) and their rank within a role, requirements and their relative priorities; to quote Lim ‘The ground truth is the complete and prioritised list of stakeholders and requirements for the project obtained by analysing the stakeholders and requirements from the start of the project until after the system is deployed.’
The term salience is used to denote the level of a stakeholder’s influence.
Data
The data consists of three stakeholder related lists created as follows (all names have been made anonymous):
- the Ground truth list: derived from existing RALIC documentation. The following is an extract from this list (individual are ranked within each stakeholder role):
Role Rank,      Stakeholder Role,       Stakeholder Rank,       Stakeholder
1,      Security and Access Systems,    1,              Mike Dawson
1,      Security and Access Systems,    2,              Jason Ortiz
1,      Security and Access Systems,    3,              Nick Kyle
1,      Security and Access Systems,    4,              Paul Haywood
2,      Estates and Facilities Division,1,              Richard Fuller
- the Open list: starting from an initial list of 22 names and 28 stakeholder roles, four iterations of [Snowball sampling] resulted in a total of 61 responses containing 127 stakeholder names+priorities and 70 stakeholder roles,
- the Closed list: a list of 50 possible stakeholders was created from the RALIC project documentation plus names of other UCL staff added as noise. The people on this list were asked to indicated which of those names on the list they considered to be stakeholders and to assign them a salience between 1 and 10, they were also given the option to suggest names of possible stakeholders. This process generated a list containing 76 stakeholders names+priorities and 39 stakeholder roles.
The following is an extract from the last two stakeholder lists:
stakeholder stakeholder role salience David Ainsley Ian More 1 David Ainsley Rachna Kaplan 6 David Ainsley Kathleen Niche 4 David Ainsley Art Waller 1 David Carne Mark Wesley 4 David Carne Lis Hands 4 David Carne Vincent Matthew 4 Keith Lyon Michael Wondor 1 Keith Lyon Marilyn Gallo 1 Kerstin Michel Greg Beech 1 Kerstin Michel Mike Dawson 6 |
Is the data believable?
The data was gathered after the project was completed and as such it is likely to contain some degree of hindsight bias.
The data cleaning process is described in detail by Lim and looks to be thorough.
Predictions made in advance
Lim drew a parallel between the stakeholder prioritisation problem and the various techniques used to rank the nodes in social network analysis, e.g., the Page Rank algorithm. The hypothesis is that there is a strong correlation exists between the rank ordering of stakeholder roles in the Grounded truth list and the rank of stakeholder roles calculated using various social network metrics.
Applicable techniques
How might a list of people and the salience they assign to other people be converted to a single salience for each person? Lim proposed that social network metrics be used. A variety of techniques for calculating social network node centrality metrics have been proposed and some of these, including most used by Lim, are calculated in the following analysis.
Lim compared the Grounded truth ranking of stakeholder roles against the stakeholder role ranking created using the following network metrics:
- betweenness centrality: for a given node it is a count of the number of shortest paths from all nodes in a graph to all other nodes in that graph that pass through the given node; the value is sometimes normalised,
- closeness centrality: for a given node closeness is the inverse of farness, which is the sum of that node’s distances to all other nodes in the graph; the value is sometimes normalised,
- degree centrality: in-degree centrality is a count of the number of edges referring to a node, out-degree centrality is the number of edges that a node refers to; the value is sometimes normalised,
- load centrality: this is a variant of betweenness centrality based on the fraction of shortest paths through a given node. Support for load centrality is not available in the
igraphpackage and so is not used here, this functionality is available in thestatnetpackage, - pagerank: the famous algorithm proposed by Page and Brin <book Page_98> for ranking web pages.
Eigenvector centrality is another commonly used network metric and is included in this analysis.
Results
The igraph package includes functions for computing many of the common social network metrics. Reading data and generating a graph (the mathematical term for a social network) from it is particularly easy, in this case the graph.data.frame function is used to create a representation of its graph from the contents of a file read by read.csv.
The figure below plots Pagerank values for each node in the network created from the Open and Closed stakeholder salience ratings (Pagerank was chosen for this example because it had one of the strongest correlations with the Ground truth ranking). There is an obvious difference in the shape of the curves: the Open saliences (green) is fitted by the equation  (black line), while the Closed saliences (blue) is piecewise fitted by
  and
and  (red lines).
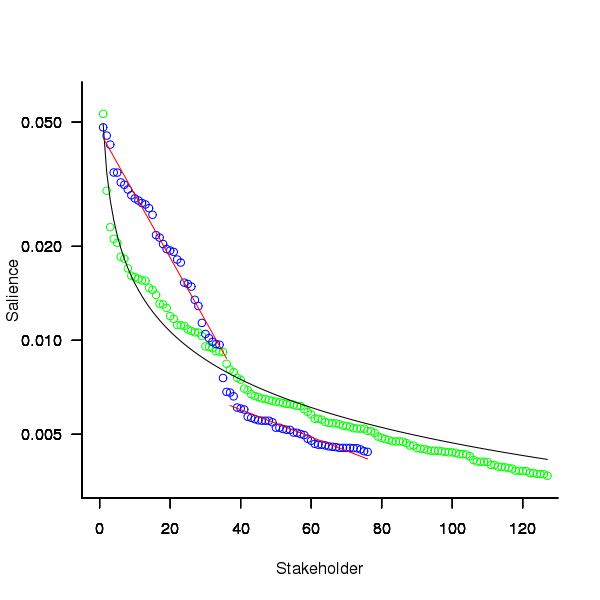
Figure 1. Plot of Pagerank of the stakeholder nodes in the network created from the Open (green) and Closed (blue) stakeholder responses (values for each have been sorted). See text for details of fitted curves.
To compare the ability of network centrality metrics to produce usable orderings of stakeholder roles a comparison has to be made against the Ground truth. The information in the Ground truth is a ranked list of stakeholder roles, not numeric values. The Stakeholder/centrality metric pairs need to be mapped to a ranked list of stakeholder roles. This mapping is achieved by associating a stakeholder role with each stakeholder name (this association was collected by Lim during the interview process), sorting stakeholder role/names by decreasing centrality metric and then ranking roles based on their first occurrence in the sorted list (see rexample[stakeholder]).
The Ground truth contains stakeholder roles not filled by any of the stakeholders in the Open or Closed data set, and vice versa. Before calculating role ranking correlation by roles not in both lists were removed.
The table below lists the Pearson correlation between the Ground truth ranking of stakeholder roles and for the ranking produced from calculating various network metrics from the Closed and Open stakeholder salience questionnaire data (when applied to ranks the Pearson correlation coefficient is equivalent to the Spearman rank correlation coefficient).
| betweenness | closeness | degree in | degree out | eigenvector | pagerank | |
|---|---|---|---|---|---|---|
|
Open
|
0.63
|
0.46
|
0.54
|
0.52
|
0.62
|
0.60
|
|
Weighted Open
|
0.66
|
0.49
|
0.62
|
0.50
|
0.68
|
0.67
|
|
Closed
|
0.51
|
0.53
|
0.67
|
0.60
|
0.69
|
0.71
|
|
Weighted Closed
|
0.50
|
0.50
|
0.63
|
0.54
|
0.68
|
0.72
|
The Open/Closed correlation calculation is based on a linear ranking. However, plotting Stakeholder salience, as in the plot above, shows a nonlinear distribution, with the some stakeholders having a lot more salience than less others. A correlation coefficient calculated by weighting the rankings may be more realistic. The “weighted” rows in the above are the correlations calculated using a weight based on the equations fitted in the Pagerank plot above; there is not a lot of difference.
Discussion
Network metrics are very new and applications making use of them still do so via a process of trial and error. For instance, the Pagerank algorithm was found to provide a good starting point for ranking web pages and many refinements have subsequently been added to the web ranking algorithms used by search engines.
When attempting to assign a priority to stakeholder roles and the people that fill them various network metric provide different ways of interpreting information about relationships between stakeholders. Lim’s work has shown that some network metrics can be used to produce ranks similar to those actually used (at least for one project).
One major factor not included in the above analysis is the financial contribution that each stakeholder role makes towards the implementation cost. Presumably those roles contributing a large percentage will want to be treated as having a higher priority than those contributing a smaller percentage.
The social network metrics calculated for stakeholder roles were only used to generate a ranking so that a comparison could be made against the ranked list available in the Ground truth. A rank ordering is a linear relationship between stakeholders; in real life differences in priority given to roles and stakeholders may not be linear. Perhaps the actual calculated network metric values are a better (often nonlinear) measure of relative difference, only experience will tell.
Summary of findings
Building a successful application is a very hard problem and being successful at it is something of a black art. There is nothing to say that a different Ground truth stakeholder role ranking would have lead to the RALIC project being just as successful. The relatively good correlation between the Ground truth ranking and the ranking created using some of the network metrics provides some confidence that these metrics might be of practical use.
Given that information on stakeholders’ rating of other stakeholders can be obtained relatively cheaply (Lim built a web site to collect this kind of information <book Lim_11>), for any large project a social network analysis appears to be a cost effect way of gathering and organizing information.
Background to my book project “Empirical Software Engineering with R”
This post provides background information that can be referenced by future posts.
For the last 18 months I have been working in fits and starts on a book that has the working title “Empirical Software Engineering with R”. The idea is to provide broad coverage of software engineering issues from an empirical perspective (i.e., the discussion is driven by the analysis of measurements obtained from experiments); R was chosen for the statistical analysis because it is becoming the de-facto language of choice in a wide range of disciplines and lots of existing books provide example analysis using R, so I am going with the crowd.
While my last book took five years to write I had a fixed target, a template to work to and a reasonably firm grasp of the subject. Empirical software engineering has only really just started, the time interval between new and interesting results appearing is quiet short and nobody really knows what statistical techniques are broadly applicable to software engineering problems (while the normal distribution is the mainstay of the social sciences a quick scan of software engineering data finds few occurrences of this distribution).
The book is being driven by the empirical software engineering rather than the statistics, that is I take a topic in software engineering and analyse the results of an experiment investigating that topic, providing pointers to where readers can find out more about the statistical techniques used (once I know which techniques crop up a lot I will write my own general introduction to them).
I’m assuming that readers have a reasonable degree of numeric literacy, are happy dealing with probabilities and have a rough idea about statistical ideas. I’m hoping to come up with a workable check-list that readers can use to figure out what statistical techniques are applicable to their problem; we will see how well this pans out after I have analysed lots of diverse data sets.
Rather than wait a few more years before I can make a complete draft available for review I have decided to switch to making available individual parts as they are written, i.e., after writing a draft discussion and analysis of each experiment I will published it on this blog (along with the raw data and R code used in the analyse). My reasons for doing this are:
- Reader feedback (I hope I get some) will help me get a better understanding of what people are after from a book covering empirical software engineering from a statistical analysis of data perspective.
- Suggestions for topics to cover. I am being very strict and only covering topics for which I have empirical data and can make that data available to readers. So if you want me to cover a topic please point me to some data. I will publish a list of important topics for which I currently don’t have any data, hopefully somebody will point me at the data that can be used.
- Posting here will help me stay focused on getting this thing done.
Links to book related posts
Distribution of uptimes for high-performance computing systems
Break even ratios for development investment decisions
Agreement between code readability ratings given by students
Changes in optimization performance of gcc over time
Descriptive statistics of some Agile feature characteristics
Impact of hardware characteristics on detectable fault behavior
Prioritizing project stakeholders using social network metrics
Preferential attachment applied to frequency of accessing a variable
Amount of end-user usage of code in Firefox
How many ways of programming the same specification?
Ways of obtaining empirical data in software engineering
What is the error rate for published mathematical proofs?
Changes in the API/non-API method call ratio with program size
Honking the horn for go faster memory (over go faster cpus)
How to avoid being a victim of Brooks’ law
Evidence for the benefits of strong typing, where is it?
Hardware variability may be greater than algorithmic improvement
Extracting the original data from a heatmap image
Entropy: Software researchers go to topic when they have no idea what else to talk about
Learning R as a language
Books written to teach a general purpose programming language are usually organized according to the features of the language and examples often show how a particular language feature is interpreted by a compiler. Books about domain specific languages are usually organized in a way that makes sense in the corresponding application domain and examples usually illustrate how a particular domain problem can be solved using the language.
I have spent a lot of time using R over the last year and by dint of reading lots of R code and various introductions to the language I have managed to piece together a model of the language. I rarely have any trouble learning a general purpose language from its reference manual, but users of domain specific languages are rarely interested in language details and so these reference manuals are usually only intended to be read by people who know the language well (another learning problem is that domain specific languages often contain quirky features rarely seen in other languages; in the case of R I was not lucky enough to know enough other languages to cover all its quirky features).
I managed to one introduction to R written from the perspective of the programming language (and not the application domain): the original The Art of R Programming by Norman Matloff has been expanded and is now available as a book.
Summary. If you know another language and want to quickly learn about the languages features of R I recommend this book. I have not taught raw beginners for over 30 years and have no idea if this book would be of any use to them.
This book does not attempt to teach you to think ‘R’, it is not about the art of R programming. The value of this book is as a single source for a broad coverage of lots of language features explained using lots of examples. Yes, more time could have been spent on the organization and fixing inconsistencies in the layout; these are not show stoppers.
Some people might tell you to buy “Software for Data Analysis” by John Chambers. Don’t; if you are a fan of Finnegans Wake and are nostalgic for the mainframe world of the 1970s you might like to give it a go. (I think Bertrand Meyer’s “Object-oriented Software Construction” is still the best book about the design of a language).
Meanderings. What books are good examples of “The Art of …” writing for domain specific languages? Two that spring to mind are: “Algorithms in Snobol 4” by James Gimpel (still spotted from time to time on second hand book sites) and more recently “SQL For Smarties: Advanced SQL Programming” by Joe Celko.
Yes, I know that R is not really a domain specific language but a language that is primarily used in one domain. Frink is an example of a language containing a major behavior feature that is specific to its intended application domain. I cannot think of any major language feature of R that is specific to statistics.
Recent Comments