Archive
Ecosystems chapter added to “Empirical software engineering using R”
The Ecosystems chapter of my Empirical software engineering book has been added to the draft pdf (download here).
I don’t seem to be able to get away from rewriting everything, despite working on the software engineering material for many years. Fortunately the sparsity of the data keeps me in check, but I keep finding new and interesting data (not a lot, but enough to slow me down).
There is still a lot of work to be done on the ecosystems chapter, not least integrating all the data I have been promised. The basic threads are there, they just need filling out (assuming the promised data sets arrive).
I did not get any time to integrate in the developer and economics data received since those draft chapters were released; there has been some minor reorganization.
As always, if you know of any interesting software engineering data, please tell me.
I’m looking to rerun the workshop on analyzing software engineering data. If anybody has a venue in central London, that holds 30 or so people+projector, and is willing to make it available at no charge for a series of free workshops over several Saturdays, please get in touch.
Projects chapter next.
Economics chapter added to “Empirical software engineering using R”
The Economics chapter of my Empirical software engineering book has been added to the draft pdf (download here).
This is a slim chapter, it might grow a bit, but I suspect not by a huge amount. Reasons include lots of interesting data being confidential and me not having spent a lot of time on this topic over the years (so my stash of accumulated data is tiny). Also, a significant chunk of the economics data I have is used to discuss issues in the Ecosystems and Projects chapters, perhaps some of this material will migrate back once these chapters are finalized.
You might argue that Economics is more important than Human cognitive characteristics and should have appeared before it (in chapter order). I would argue that hedonism by those involved in producing software is the important factor that pushes (financial) economics into second place (still waiting for data to argue my case in print).
Some of the cognitive characteristics data I have been waiting for arrived, and has been added to this chapter (some still to be added).
As always, if you know of any interesting software engineering data, please tell me.
I am after a front cover. A woodcut of alchemists concocting a potion appeals, perhaps with various software references discretely included, or astronomy related (the obvious candidate has already been used). The related modern stuff I have seen does not appeal. Suggestions welcome.
Ecosystems next.
I have been reading your interesting paper
In the last six years or so I have sent around 420 emails whose first line started: “I have been reading your interesting paper”, followed a few lines later by: “Would it be possible to obtain a copy of the data?”, and then some background and links to blog posts and my previous book.
The response break down is roughly as follows:
Received data 136 32% No reply 132 32% Pending (received a positive reply) 49 12% Confidential 42 10% No longer have the data 20 5% Best known address bounces 11 3% |
Thanks to those 136 researchers who took the time to collect together their data and send me a copy.
The “No reply” response get a second email 6-9 months after the first. I’m hoping that the availability of a draft of the book will generate some positive publicity that reminds researchers they have had an email from me and are missing out.
The “Confidential” case is relatively low because it is often obvious that the data is confidential and I don’t bother asking for a copy (I only use data that can be made public).
A common reason behind “No longer have the data” is a change of laptop and sometimes a change of jobs. If the paper is more than five years old, I tend not to ask unless the data looks very interesting. Mine and others’ experiences show that research data has a relatively short half-life.
I try quite hard to find a workable address, sometimes emailing supervisors and going via LinkedIn.
Empirical Software Engineering using R: first draft available for download
A draft of my book Empirical Software Engineering using R is now available for download.
The book essentially comes in two parts:
- statistical techniques that are useful for analyzing software engineering data. This draft release contains most of the techniques I plan to cover. I am interested in hearing about any techniques you think ought to be covered, but I only cover techniques when real data is available to use in an example,
- six chapters covering what I consider to be the primary aspects of software engineering. This draft release includes the Human Cognitive Characteristics chapter and I am hoping to release one each of the remaining chapters every few months (Economics is next).
There is a page for making suggestions and problem reports.
All the code+data is available and I am claiming to have a copy of all the important, publicly available, software engineering data. If you know of any I don’t have, please let me know.
I am looking for a publisher. The only publisher I have had serious discussions with decided not to go ahead because of my insistence of releasing a free copy of the pdf. Self-publishing is a last resort.
Software engineering data sets
The pretty pictures from my empirical software engineering book are now online, along with the 210 data sets and R code (330M).
Plotting the number of data sets in each year shows that empirical software engineering has really taken off in the last 10 years (code+data). Around dozen or so confidential data sets are not included; I am only writing about data that can be made public.
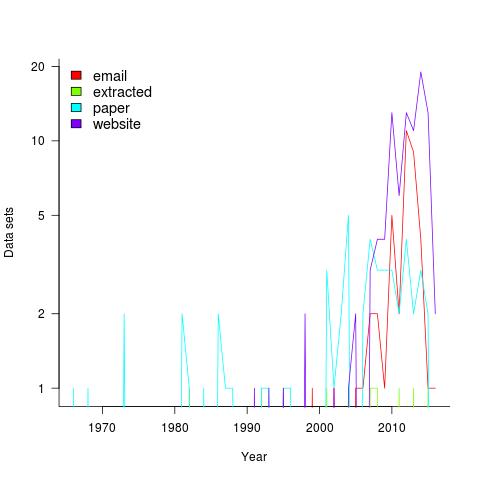
It used to be rare to find the data associated with a paper on the author’s website. Of course, before around 1995 there was no web, but since around 2012 the idea has started to take off.
Contact via email goes back to 1985 and before that people sent mag tapes through the post and many years ago somebody sent me punched tape (there is nothing like seeing the bits with the naked eye).
I have sent several hundred emails asking for data and received 55 data sets. I’m hoping this release will spur those who have promised me data to invest some time to send it.
My experience is that research data often lives on laptops and dies when the laptop is replaced (a study of biologists, who have been collecting data for hundreds of years, found a data ‘death rate’ of 17% a year). Had I started actively collecting data before 2010 the red line in the plot would be much higher for earlier years; I often received data from authors when writing my C book at the start of the century (Google went from nothing to being the best place to search, while I wrote).
In nine cases I extracted the data, either from the pdf or an image and then reverse engineered values.
I have around 50 data sets waiting to be processed. Given that lots more are bound to arrive before the book is finished, I expect to easily reach the 300 mark. A tiny number given my aim of writing about all software engineering issues for which public data exists.
If you know of interesting software engineering data, that is not to be found in these plots, please let me know.
Applied Software Measurement: shame about the made up numbers
“Applied Software Measurement” by Capers Jones (no relation) is widely cited, but I find it a very frustrating book; while the text is full of useful commentary the numbers in the tables are mostly made up or estimated from other numbers (some of which may be actual measurements).
This book’s many tables of numbers will catch the attention of anyone searching for software engineering data (which until recently was very hard to find). However, closer inspection of the numbers suggests that the real purpose of the empirical looking tables is to serve as eye-candy to impress casual readers.
Let’s take as an example the analysis of multiple implementations, in different languages, of software implementing telephone switching system functionality. The numbers are from the third edition of the book (the one I have; code+data, separate paper discussing the numbers).
Below are the numbers from Table 2-7: Function Point and Source Code Sizes for 10 Versions of the Same Project.
All those 1,500’s are a bit suspicious; the second paragraph under the table says “… the original sizes ranged from about 1,300 to 1,750 …”. Why has a gratuitous 1.5% error been introduced?
Where did the values for language level come from? I once wrote the semantics phase of a CHILL compiler in Pascal and would have put CHILL’s language level on a par with Ada83. Objective C at 11 is surely a joke. Language level is a number, so obviously we can take its average.
This table looks like it has one column of actual data. Oh, five pages before the table appears we are told that the Ada95 and Objective C results were modeled, i.e., made up. So there are really only eight real implementations, not ten.
Language Function pts Language level LOC/Func. Pt. Size in LOC Assembly 1,500 1 250 375,000 C 1,500 3 127 190,500 CHILL 1,500 3 105 157,500 PASCAL 1,500 4 91 136,500 PL/I 1,500 4 80 120,000 Ada83 1,500 5 71 106,500 C++ 1,500 6 55 82,500 Ada95 1,500 7 49 73,500 Objective C 1,500 11 29 43,500 Smalltalk 1,500 15 21 31,500 Average 1,500 6 88 131,700 |
Moving on to Table 2-6, see below: “Staff Months of Effort for 10 Versions of the Same Software Project”
The use of two decimal places of accuracy is an obvious red flag for wanting to impress via appearance of accuracy.
Is the requirements effort based on one known value, or is it estimated? Why the jump in design time when we get to C++? Does management time really have such a strong dependency on language used?
Language Require.. Design Code Test Document Management TOTAL Effort Assembly 13.64 60.00 300.00 277.78 40.54 89.95 781.91 C 13.64 60.00 152.40 141.11 40.54 53.00 460.69 CHILL 13.64 60.00 116.67 116.67 40.54 45.18 392.69 PASCAL 13.64 60.00 101.11 101.11 40.54 41.13 357.53 PL/I 13.64 60.00 88.89 88.89 40.54 37.95 329.91 Ada83 13.64 60.00 76.07 78.89 40.54 34.99 304.13 C++ 13.64 68.18 66.00 71.74 40.54 33.81 293.91 Ada95 13.64 68.18 52.50 63.91 40.54 31.04 269.81 Objective C 13.64 68.18 31.07 37.83 40.54 24.86 216.12 Smalltalk 13.64 68.18 22.50 27.39 40.54 22.39 194.64 |
The above table makes more sense when LOC is plotted against Total Effort (in man months), see below:
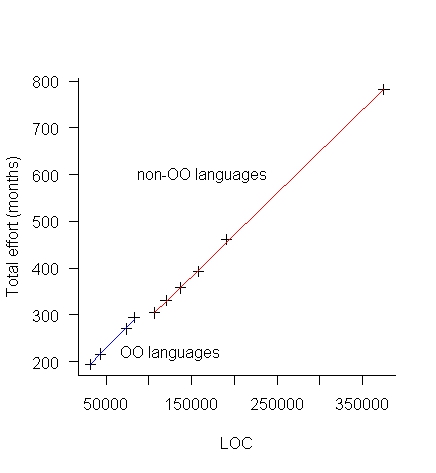
The blue line is for the object oriented languages (i.e., the last four rows of the table) and the red line everything else. Those two straight lines fit the data so well; I think that Total Effort was calculated from LOC and various rules of thumb used to create percentages for requirements, design, code, test, documentation and management.
There is no new data in the above table, it was all calculated from LOC and informed arm waving.
Table 2-9 and Table 2-11 list Total Effort (which has been estimated from LOC) and columns of values created by dividing or multiplying this by other estimated values.
Table 2-12, see below: “Defect Potentials for 10 Versions of the Same Software Project”
What is a Defect Potentials?
Again, a sudden jump in the design numbers at C++.
Language Require.. Design Code Document Bad Fix TOTAL Defects Assembly 1,500 1,875 7,500 900 1,060 12,835 C 1,500 1,875 3,810 900 728 8,813 CHILL 1,500 1,875 3,150 900 668 8,093 PASCAL 1,500 1,875 2,730 900 630 7,635 PL/I 1,500 1,875 2,400 900 601 7,276 Ada83 1,500 1,875 2,130 900 576 6,981 C++ 1,500 2,025 1,650 900 547 6,622 Ada95 1,500 2,025 1,470 900 531 6,426 Objective C 1,500 2,025 870 900 477 5,772 Smalltalk 1,500 2,025 630 900 455 5,510 |
Plotting total defects against LOC (below) suggests that “Defect Potentials” is a number calculated from LOC, i.e., no connection with actual defects found.
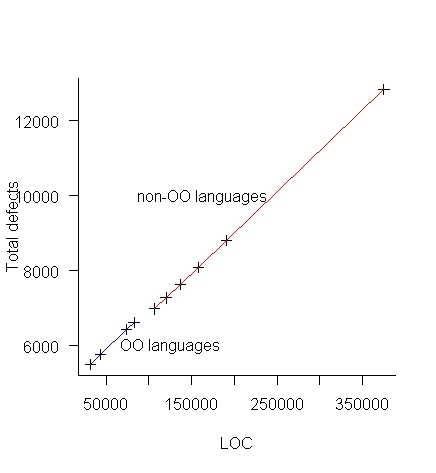
Table 2-13 lists Total Defects (which has been estimated from LOC) and columns of values created by dividing or multiplying this by other estimated values.
So the book contains six impressive looking tables whose numbers have been calculated in one way or another from lines of code. A very good description of the many other tables in the book.
Workshop on survival and time series analysis in empirical SE
In January the material in my book on Empirical software engineering using R had its first exposure to professional software developers at a one day workshop (there was a rerun last week; slides here). The sessions were both fully booked, but as often happens on half turned up, around 15 at each workshop. A couple of people turned up expecting to be taught R and found themselves in a software engineering workshop that assumed the attendees could learn R in 10 minutes (because professional developers are experienced enough to learn the basics of programming in any language in that amount of time).
The main feedback was that people wanted to see more code, something to give them a starting point for the hands-on sessions (I hate seeing reams and reams of code on slides and had gone too far in the minimalist direction).
The approach of minimizing what developers have to learn/remember, even if it means using more computer resources (e.g., always using glm), went down very well.
The probability & statistics material, in the session before lunch, had a mixed reception; this is partly because I have not come up with a clear message and I’m trying to get over several disparate ideas, i.e., sampling issues, life is complicated and p-values. People were a bit unhappy about the life is complicated, data is messy and you have to think about what you are doing message.
I think the regression model building material was a hit. People saw the potential in fitting curves to data and found it easy to do once the parameters to plot, lines, glm and predict were sorted out. There was lots of interesting discussion around interpreting the fitted models, with me continually hamming on the point that p-value selection was a business risk factor decision and what constituted a good model depended on what it was going to be used for.
Those attending wanted to learn more, which is great since the main aim was to show people what useful things could be done to motivate them to go off and learn more (relatively little may be known about empirical software engineering, but there is more than can be fitted into a one day workshop)
There is a part-2 workshop in March and the plan is to cover survival analysis, time series analysis and if there is time something else. It will be assumed that people have the skill level of those who attended the first workshop, e.g., can write basic R and fit a simple regression model.
Thanks to The Rise for sponsoring the venue for all three workshops.
A book of wrongheadedness from O’Reilly
Writers of recommended practice documents usually restrict themselves to truisms, platitudes and suggestions that doing so and so might not be a good idea. However, every now and again somebody is foolish enough to specify limits on things like lines of code in a function/method body or some complexity measure.
The new O’Reilly book “Building Maintainable Software Ten Guidelines for Future-Proof Code”
(free pdf download until 25th January) is a case study in wrongheaded guideline thinking; probably not the kind of promotional vehicle for the Software Improvement Group, where the authors work, that was intended.
A quick recap of some wrongheaded guideline thinking:
- if something causes problems, recommend against it,
- if something has desirable behavior, recommend use it,
- ignore the possibility that any existing usage is the least worst way of doing things,
- if small numbers are involved, talk about the number 7 and human short term memory,
- discuss something that sounds true and summarize by repeating the magical things that will happen developer people follow your rules.
Needless to say, despite a breathless enumeration of how many papers the authors have published, no actual experimental evidence is cited as supporting any of the guidelines.
Let’s look at the first rule:
Limit the length of code units to 15 lines of code
Various advantages of short methods are enumerated; this looks like a case of wrongheaded item 2. Perhaps splitting up a long method will create lots of small methods with desirable properties. But what of the communication overhead of what presumably is a tightly coupled collection of methods? There is a reason long methods are long (apart from the person writing the code not knowing what they are doing), having everything together in one place can be more a more cost-effective use of developer resources than lots of tiny, tightly coupled methods.
This is a much lower limit than usually specified, where did it come from? The authors cite a study of 28,000 lines of Java code (yes, thousand not million) found that 95.4% of the methods contained at most 15 lines. Me thinks that methods with 14 or fewer lines came in just under 95%.
Next chapter/rule:
Limit the number of branch points per unit to 4
I think wrongheaded items 2, 3 & 5 cover this.
Next:
Do not copy code
Wrongheaded item 1 & 3 for sure. Oh, yes, there is empirical research showing that most code is never changed and cloned code contains fewer faults (but not replicated as far as I know).
Next:
Limit the number of parameters per unit to at most 4
Wrongheaded item 2. The alternatives are surely much worse. I have mostly seen this kind of rule applied to embedded systems code where number of parameters can be a performance issue. Definitely not a top 10 guideline issue.
Next…: left as an exercise for the reader…
What were the authors thinking when they wrote this nonsense book?
Of course any thrower of stones should give the location of his own glass house. Which is 10 times longer, measures a lot more than 28k of source and cites loads of stuff, but only manages to provide a handful of nebulous guidelines. Actually the main guideline output is that we know almost nothing about developer’s cognitive functioning (apart from the fact that people are sometimes very different, which is not very helpful) or the comparative advantages/disadvantages of various language constructs.
R recommended usage for professional developers
R is not one of those languages where there is only one way of doing something, the language is blessed/cursed with lots of ways of doing the same thing.
Teaching R to professional developers is easy in the sense that their fluency with other languages will enable them to soak up this small language like a sponge, on the day they learn it. The problems will start a few days after they have been programming in another language and go back to using R; what they learned about R will have become entangled in their general language knowledge and they will be reduced to trial and error, to figure out how things work in R (a common problem I often have with languages I have not used in a while, is remembering whether the if-statement has a then keyword or not).
My Empirical software engineering book uses R and is aimed at professional developers; I have been trying to create a subset of R specifically for professional developers. The aims of this subset are:
- behave like other languages the developer is likely to know,
- not require knowing which way round the convention is in R, e.g., are 2-D arrays indexed in row-column or column-row order,
- reduces the likelihood that developers will play with the language (there is a subset of developers who enjoy exploring the nooks and crannies of a language, creating completely unmaintainable code in the process).
I am running a workshop based on the book in a few weeks and plan to teach them R in 20 minutes (the library will take a somewhat longer).
Here are some of the constructs in my subset:
- Use
subsetto extract rows meeting some condition. Indexing requires remembering to do it in row-column order and weird things happen when commas accidentally get omitted. - Always call
read.csvwith the argumentas.is=TRUE. Computers now have lots of memory and this factor nonsense needs to be banished to history. - Try not to use for loops. This will probably contain array/data.frame indexing, which provide ample opportunities for making mistakes, use the
*applyor*plyfunctions (which have the added advantage of causing code to die quickly and horribly when a mistake is made, making it easier to track down problems). - Use
headto remove the lastNelements from an object, e.g.,head(x, -1)returns x with the last element removed. Indexing with the length minus one is a disaster waiting to happen.
It’s a shame that R does not have any mechanism for declaring variables. Experience with other languages has shown that requiring variables to be declared before use catches lots of coding errors (this could be an optional feature so that those who want their ‘freedom’ can have it).
We now know that support for case-sensitive identifiers is a language design flaw, but many in my audience will not have used a language that behaves like this and I have no idea how to help them out.
There are languages in common use whose array bounds start at one. I will introduce R as a member of this club. Not much I can do to help out here, except the general suggestion not to do array indexing.
Suggestions based on reader’s experiences welcome.
The Empirical Investigation of Perspective-Based Reading: Data analysis
Questions about the best way to perform code reviews go back almost to the start of software development. The perspective-based reading approach focuses reviewers’ attention on the needs of the users of the document/code, e.g., tester, user, designer, etc, and “The Empirical Investigation of Perspective-Based Reading” is probably the most widely cited paper on the subject. This paper is so widely cited I decided it was worth taking the time to email the authors of a 20 year old paper asking if the original data was available and could I have a copy to use in a book I am working on. Filippo Lanubile’s reply included two files containing the data (original files, converted files+code)!
How do you compare the performance of different approaches to finding problems in documents/code? Start with experienced subjects, to minimize learning effects during the experiment (doing this also makes any interesting results an easier sell; professional developers know how unrealistic student performance tends to be); the performance of subjects using what they know has to be measured first, learning another technique first would contaminate any subsequent performance measurements.
In this study subjects reviewed four documents over two days; the documents were two NASA specifications and two generic domain specifications (bank ATM and parking garage); the documents were seeded with faults. Subjects were split into two groups and read documents in the following sequences:
Group 1 Group 2 Day 1 NASA A NASA B ATM PG Day 2 Perspective-based reading training PG ATM NASA B NASA A |
The data contains repeated measurements of the same subject (i.e., their performance on different documents using one of two techniques), so mixed-model regression has to be used to build a model.
I built two models, one for number of faults detected and the another for the number of false positive faults flagged (i.e., something that was not a fault flagged as a fault).
The two significant predictors of percentage of known faults detected were kind of document (higher percentage detected in the NASA documents) and order of document processing on each day (higher percentage reported on the first document; switching document kind ordering across groups would have enabled more detail to be teased out).
The false positive model was more complicated, predictors included number of pages reviewed (i.e., more pages reviewed more false positive reports; no surprise here), perspective-based reading technique used (this also included an interaction with number of years of experience) and kind of document.
So use of perspective-based reading did not make a noticeable difference (the false positive impact was in amongst other factors). Possible reasons that come to mind include subjects not being given enough time to switch reading techniques (people need time to change established habits) and some of the other reading techniques used may have been better/worse than perspective-based reading and overall averaged out to no difference.
This paper is worth reading for the discussion of the issues involved in trying to control factors that may have a noticeable impact on experimental results and the practical issues of using professional developers as subjects (the authors clearly put a lot of effort into doing things right).
Please let me know if you build any interesting model using the data.
Recent Comments