Archive
1970s: the founding decade of software reliability research
Reliability research is a worthwhile investment for very large organizations that fund the development of many major mission-critical software systems, where reliability is essential. In the 1970s, the US Air Force’s Rome Air Development Center probably funded most of the evidence-based software research carried out in the previous century. In the 1980s, Rome fell, and the dark ages lasted for many decades (student subjects, formal methods, and mutation testing).
Organizations sponsor research into software reliability because they want to find ways of reducing the number of coding mistakes, and/or the impact of these mistakes, and/or reduce the cost of achieving a given level of reliability.
Control requires understanding, and understanding reliability first requires figuring out the factors that are the primarily drivers of program reliability.
How did researchers go about finding these primary factors? When researching a new field (e.g., software reliability in the 1970s), people can simply collect the data that is right in front of them that is easy to measure.
For industrial researchers, data was collected from completed projects, and for academic researchers, the data came from student exercises.
For a completed project, the available data are the reported errors and the source code. This data be able to answer questions such as: what kinds of error occur, how much effort is needed to fix them, and how common is each kind of error?
Various classification schemes have been devised, including: functional units of an application (e.g., computation, data management, user interface), and coding construct (e.g., control structures, arithmetic expressions, function calls). As a research topic, kinds-of-error has not attracted much attention; probably because error classification requires a lot of manual work (perhaps the availability of LLMs will revive it). It’s a plausible idea, but nobody knows how large an effect it might be.
Looking at the data, it is very obvious that the number of faults increases with program size, measured in lines of code. These are two quantities that are easily measured and researchers have published extensively on the relationship between faults (however these are counted) and LOC (counted by function/class/file/program and with/without comments/blank lines). The problem with LOC is that measuring it appears to be too easy, and researchers keep concocting more obfuscated ways of counting lines.
What do we now know about the relationship between reported faults and LOC? Err, … The idea that there is an optimal number of LOC per function for minimizing faults has been debunked.
People don’t appear to be any nearer understanding the factors behind software reliability than at the end of the 1970s. Yes, tool support has improved enormously, and there are effective techniques and tools for finding and tracking coding mistakes.
Mistakes in programs are put there by the people who create the programs, and they are experienced by the people who use the programs. The two factors rarely researched in software reliability are the people building the systems and the people using them.
Fifty years later, what software reliability books/reports from the 1970s have yet to be improved on?
The 1987 edition (ISBN 0-07-044093-X) of “Software Reliability: Measurement, Prediction, Application” by Musa, Iannino, and Okumoto is based on research done in the 1970s (the 1990 professional edition is not nearly as good). Full of technical details, but unfortunately based on small datasets.
The 1978 book Software Reliability by Thayer, Lipow and Nelson, remains a go-to source for industrial reliability research data.
A good example of the industrial research funded by the Air Force is the 1979 report Software Data Baseline Analysis by D. L. Fish and T. Matsumoto. This is worth looking at just to learn how few rows of data later researchers have been relying on.
The units of measurement for software reliability
How do the people define software reliability? One answer can be found by analyzing defect report logs: one study found that 42.6% of fault reports were requests for an enhancement, changes to documentation, or a refactoring request; a study of NASA spaceflight software found that 63% of reports in the defect tracking system were change requests.
Users can be thought of as broadly defining software reliability as the ability to support current (i.e., the software works as intended) and future needs (i.e., functionality that the user does not yet know they need, e.g., one reason I use R, rather than Python, for data analysis, is because I believe that if a new-to-me technique is required, a package+documentation supporting this technique is more likely to be available in R).
Focusing on current needs, the definition of software reliability depends on the perspective of who you ask, possibilities include:
- commercial management: software reliability is measured in terms of cost-risk, i.e., the likelihood of losing an amount £/$ as a result of undesirable application behavior (either losses from internal use, or customer related losses such as refunds, hot-line support, and good will),
- Open source: reliability has to be good enough and at least as good as comparable projects. The unit of reliability might be fault experiences per use of the program, or the number of undesirable behaviors encountered when processing pre-existing material,
- user-centric: mean time between failure per uses of the application, e.g., for a word processor, documents written/edited. For compilers, mean time between failure per million lines of source translated,
- academic and perhaps a generic development team: mean time between failure per million lines/instructions executed by the application. The definition avoids having to deal with how the software is used,
- available data: numeric answers require measurement data to feed into a calculation. Data that is relatively easy to collect is cpu time consumed by tests that found some number of faults, or perhaps wall time, or scraping the bottom of the barrel the number of tests run.
If an organization wants to increase software reliability, they can pay to make the changes that increase reliability. Pointing this fact out to people can make them very annoyed.
Student projects for 2024/2025
It will soon be that time of year when university students are looking for an interesting idea for a project. On an irregular basis, I post some ideas for thesis projects (here and here); primarily for students studying computing. In a change of direction, this post suggests software related ideas for business student projects.
Two idea areas require data analysis skills, one requires people skills, and one an interest in theory.
More suggestions welcome in the comments.
Career paths in software
Organizations employ people to work on software systems. What is the career path of people who work on software systems? Question include: how long people stay in a particular job or company, and salary changes over time (the only data I know of investigates the career paths of 500 people working in IT).
Governments are interested in employment, and they collect and publish data at various levels of granularity. The US Bureau of Labor Statistics contains a vast amount of information, but finding the bits of interest can require a lot of work.
In the US, government employee salary is public information, and various sites make this available, e.g., OpePayrolls and Transparent California. There is a Japanese Open Salaries, and various commercial companies operate an open salary policy (Buffer is perhaps the most famous).
This project requires students with some data analysis skills.
There is some data on job postings,
Computer company lifecycle
Companies are born, do business and eventually die (unless bought/merged). How do the lifecycle characteristics of computer companies differ from companies doing business in other domains? Lifecycle characteristics of interest might include profiles of age, number of employees, and profitability. What are the consequences, if any, of these differences?
Details of all UK registered companies are freely available from Companies House.
Open Corporates provides company information from across the world, but it is not free in bulk.
Some analysis of the geographical clustering of software companies in the UK.
This project requires students with some data analysis skills.
AI startup ecosystem
AI has exploded on the tech scene, and lots of people are creating startups to build services/products around LLMs. Teams are very fluid, with people moving around a lot looking for a viable service/product. Sometimes these teams form companies, and these might eventually leave stealth mode and become visible. What are the characteristics of the AI startup ecosystem within a city; questions include: how many people are working within it, their backgrounds, and the business areas are they focusing on?
This project requires students with people skills and a willingness to get out and about. Much of the current AI ecosystem is only visible to those within it. Evening meetups and workshops offer a way into this personal network. This research involves bootstrapping the data gathering by spending evenings schmoozing with founders and their new hires, and is probably only practical in major cities with a very active tech meeting scene.
An analysis of a Dutch software business network.
Theoretical analysis
Those with an interest in theory might like to analyse cost-benefit decision-making within software development. Examples of simple analysis+supporting data include:
Analysis of when refactoring becomes cost-effective, and Cost-effectiveness decision for fixing a known coding mistake, and Break even ratios for development investment decisions
Memory bandwidth: 1991-2009
The Stream benchmark is a measure of sustained memory bandwidth; the target systems are high performance computers. Sustained in the sense of distance running, rather than a short sprint (the term for this is peak memory bandwidth and occurs when the requested data is in cache), and bandwidth in the sense of bytes of memory read/written per second (implemented using chunks the size of a double precision floating-point type). The dataset contains 1,018 measurements collected between 1991 and 2009.
The dominant characteristic of high performance computing applications is looping over very large arrays, performing floating-point operations on all the elements. A fast floating-point arithmetic unit has to be connected to a memory subsystem that can keep it fed with new floating-point values and write back computed values.
The Stream benchmark, in Fortran and C, defines several arrays, each containing max(1e6, 4*size_of_available_cache) double precision floating-point elements. There are four loops that iterate over every element of the arrays, each loop containing a single statement; see Fortran code in the following table (q is a scalar, array elements are usually 8-bytes, with add/multiply being the floating-point operations):
Name Operation Bytes FLOPS Copy a(i) = b(i) 16 0 Scale a(i) = q*b(i) 16 1 Sum a(i) = b(i) + c(i) 24 1 Triad a(i) = b(i) + q*c(i) 24 2 |
A system’s memory bandwidth will depend on the speed of the DRAM chips, the performance of the devices that transport bytes to the cpu, and the ability of the cpu to handle incoming traffic. The Stream data contains 21 columns, including: the vendor, date, clock rate, number of cpus, kind of memory (i.e., shared/distributed), and the bandwidth in megabytes/sec for each of the operations listed above.
How does the measured memory bandwidth change over time?
For most of the systems, the values for each of Copy, Scale, Sum, and Triad are very similar. That the simplest statement, Copy, is sometimes a bit faster/slower than the most complicated statement, Triad, shows that floating-point performance is much smaller than the time taken to read/write values to memory; the performance difference is random variation.
Several fitted regression models explain over half of the variance in the data, with the influential explanatory variables being: clock speed, date, type of system (i.e., PC/Mac or something much more expensive). The plot below shows MB/sec for the Copy loop, with three fitted regression models (code+data):
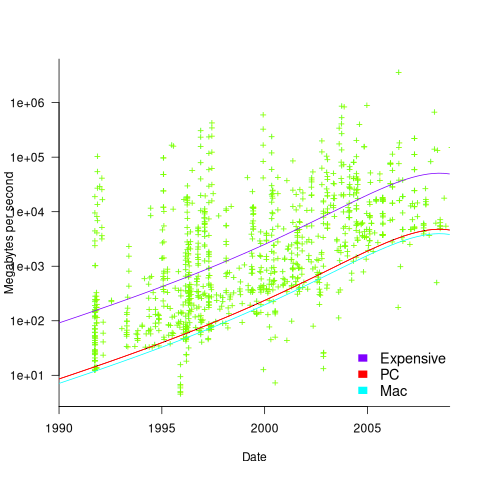
Fitting these models first required fitting a model for cpu clock rate over time; predictions of mean clock rate over time are needed as input to the memory bandwidth model. The three bandwidth models fitted are for PCs (189 systems), Macs (39 systems), and the more expensive systems (785; the five cluster systems were not fitted).
There was a 30% annual increase in memory bandwidth, with the average expensive systems having an order of magnitude greater bandwidth than PCs/Macs.
Clock rates stopped increasing around 2010, but go faster DRAM standards continue to be published. I assume that memory bandwidth continues to increase, but that memory performance is not something that gets written about much. The memory bandwidth on my new system is  MB/sec. This 2024 sample of one is 3.5 times faster than the average 2009 PC bandwidth, which is 100 times faster than the 1991 bandwidth.
The LINPACK benchmarks are the traditional application oriented cpu benchmarks used within the high performance computer community.
Recent Comments