Archive
Learning useful stuff from the Human cognition chapter of my book
What useful, practical things might professional software developers learn from the Human cognition chapter in my evidence-based software engineering book (an updated beta was release this week)?
Last week I checked the human cognition chapter; what useful things did I learn (combined with everything I learned during all the other weeks spent working on this chapter)?
I had spent a lot of time of learning about cognition when writing my C book; for this chapter I was catching up on what had happened in the last 10 years, which included: building executable models has become more popular, sample size has gotten larger (mostly thanks to Mechanical Turk), more researchers are making their data available on the web, and a few new theories (but mostly refinements of existing ideas).
Software is created by people, and it always seemed obvious to me that human cognition was a major topic in software engineering. But most researchers in computing departments joined the field because of their interest in maths, computers or software. The lack of interested in the human element means that the topic is rarely a research topic. There is a psychology of programming interest group, but most of those involved don’t appear to have read any psychology text books (I went to a couple of their annual workshops, and while writing the C book I was active on their mailing list for a few years).
What might readers learn from the chapter?
Visual processing: the rationale given for many code layout recommendations is plain daft; people need to learn something about how the brain processes images.
Models of reading. Existing readability claims are a joke (or bad marketing, take your pick). Researchers have been using eye trackers, since the 1960s, to figure out what actually happens when people read text, and various models have been built. Market researchers have been using eye trackers for decades to work out where best to place products on shelves, to maximise sales. In the last 10 years software researchers have started using eye trackers to study how people read code; next they need to learn about some of the existing models of how people read text. This chapter contains some handy discussion and references.
Learning and forgetting: it takes time to become proficient; going on a course is the start of the learning process, not the end.
One practical take away for readers of this chapter is being able to give good reasons how other people’s proposals, that are claimed to be based on how the brain operates, won’t work as claimed because that is not how the brain works. Actually, most of the time it is not possible to figure out whether something will work as advertised (this is why user interface testing is such a prolonged, and expensive, process), but the speaker with the most convincing techno-babble often wins the argument 🙂
Readers might have a completely different learning experience from reading the human cognition chapter. What useful things did you learn from the human cognition chapter?
Warp your data to make it visually appealing
Data plots can sometimes look very dull and need to be jazzed up a bit. Now, nobody’s suggesting that the important statistical properties of the data be changed, but wouldn’t it be useful if the points could be moved around a bit, to create something visually appealing without losing the desired statistical properties?
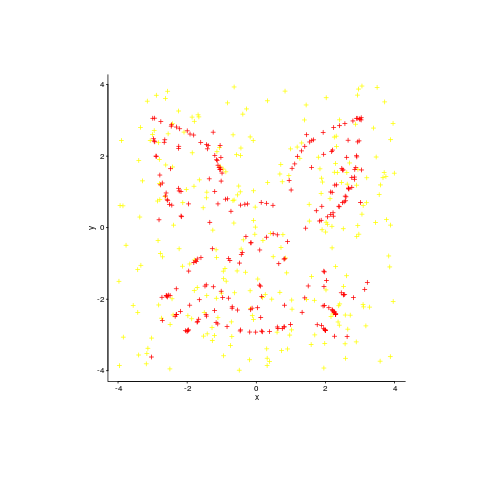
Readers have to agree that the plot below looks like fun. Don’t you wish your data could be made to look like this?

Well, now you can (code here, inspired by Matejka and Fitzmaurice who have not released their code yet). It is also possible to thin-out the points, while maintaining the visual form of the original image.
The idea is to perturb the x/y position of very point by a small amount, such that the desired statistical properties are maintained to some level of accuracy:
check_prop=function(new_pts, is_x)
{
if (is_x)
   return(abs(myx_mean-stat_cond(new_pts)) < 0.01)
else
   return(abs(myy_mean-stat_cond(new_pts)) < 0.01)
}


mv_pts=function(pts)
{
repeat
   {
   new_x=pts$x+runif(num_pts, -0.01, 0.01)
   if (check_prop(new_x, TRUE))
      break()
   }

repeat
   {
   new_y=pts$y+runif(num_pts, -0.01, 0.01)
   if (check_prop(new_y, FALSE))
      break()
   }

return(data.frame(x=new_x, y=new_y))
} |
The distance between the perturbed points and the positions of the target points then needs to be calculated. For each perturbed point its nearest neighbor in the target needs to be found and the distance calculated. This can be done in  using kd-trees and of course there is an R package, RANN, do to this (implemented in the
 nn2 function). The following code tries to minimize the sum of the distances, another approach is to minimize the mean distance:
mv_closer=function(pts)
{
repeat
   {
   new_pts=mv_pts(pts)
   new_dist=nn2(rabbit, new_pts, k=1)
   if (sum(new_dist$nn.dists) < cur_dist)
      {
      cur_dist <<- sum(new_dist$nn.dists)
      return(new_pts)
      }
   }

} |
Now it’s just a matter of iterating lots of times, existing if the distance falls below some limit:
iter_closer=function(tgt_pts, src_pts)
{
cur_dist <<- sum(nn2(tgt_pts, src_pts, k=1)$nn.dists)
cur_pts=src_pts
for (i in 1:5000)
   {
   new_pts=mv_closer(cur_pts)
   cur_pts=new_pts
   if (cur_dist < 13)
      return(cur_pts)
   }
return(cur_pts)
} |
This code handles a single statistical property. Matejka and Fitzmaurice spent more than an hour on their implementation, handle multiple properties and use simulated annealing to prevent being trapped in local minima.
An example, with original points in yellow:

Enjoy.
Recent Comments