Archive
Benchmarking string search algorithms
Searching a sequence of items for occurrences of a specific pattern is a common operation, and researchers are still discovering faster string search algorithms.
While skimming the paper Efficient Exact Online String Matching Through Linked Weak Factors by M. N. Palmer, S. Faro, and S. Scafiti, Tables 1, 2 and 3 jumped out at me. The authors put a lot of effort into benchmarking the performance of 21 search algorithms representing a selection of go-faster techniques (they wanted to show that their new algorithm, using hash chains, was the fastest; Grok explains the paper). I emailed the authors for the data, and Matt Palmer kindly added it to the HashChain Github repo. Matt was also generous with his time answering my questions.
The benchmark search involved three sequences of items, each of 100MB, a genome sequence, a protein sequence and English text. The following analysis if based on results from searching the English text. The search process returned the number of occurrences of the pattern in the character sequence.
The patterns to search for were randomly extracted from the sequence being searched. Eleven pattern lengths were used, ranging from 4 to 4,096 items in powers of 2 (the tables in the paper list lengths in the range 8 to 512). There were 500 runs for each length, with a different pattern used each time, i.e., a total of 5,500 patterns. Every search algorithm matched the same 5,500 patterns.
Some algorithms have tuneable parameters (e.g., the number of characters hashed), and 107 variants of the 21 algorithms were run, giving a total of 555,067 timing measurements (a 200ms time limit sometimes prevented a run completing).
To understand some of the patterns present in the timing results, it’s necessary to know something about how industrial strength string search algorithms work. The search pattern is first processed to create either a finite state machine or some other data structure. The matching process starts at the right of the pattern and moves left, comparing items. This approach makes it possible to skip over sequences of text that cannot match. For instance, if the current text character is X, this is fed into the finite state machine created from the pattern, and if X is not in the pattern, the matching process can move forward by the length of the pattern (if the pattern contains an X, the matching process skips forward the appropriate number of characters). This pattern shift technique was first implemented in the Boyer-Moore algorithm in 1977.
One consequence of skipping over sequences that cannot match, is that longer pattern enable longer skips, resulting in faster searches. The following plot shows the search time against pattern length for two algorithms; total time includes preprocessing the pattern and searching the text (red plus symbols have been offset by 10% to show both timings; code+data):
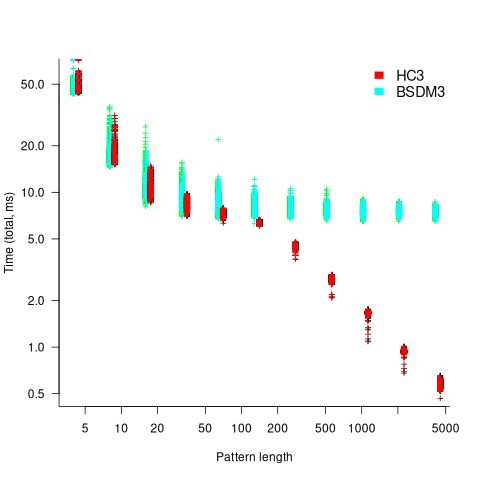
Why does the search time for HC3 (one variant of the author’s new algorithm) start to plateau and then start decreasing again? One possible cause of this saddle point is the cpu cache line width, which is 64 bytes on the system that ran the benchmarks. When the skip length is at least twice the cache line width, it is not necessary to read characters that would cause the filling of at least one cache line. As always, further research is needed.
What is the most informative method for comparing the algorithm/tool performance?
The most commonly used method is to compare mean performance times, and this is what the authors do for each pattern length. A related alternative, given that different patterns are used for each run, is to compare median times, on the basis that users are interested in the fastest algorithm across many patterns. When variance in the search times is taken into account, there is no clear winner across all pattern lengths (the uncertainty in the mean value is sometimes larger than the difference in performance).
Comparing performance across pattern lengths is interesting for algorithm designers, but users want a single performance value. The traditional approach to building a single model, that would include pattern length and algorithm, is to fit a regression model. However, this approach requires that the change in performance with pattern length roughly have the same form across all algorithms. The plot above clearly shows two algorithms with different forms of change of timing behavior with pattern length (other algorithms exhibit different behaviors).
A completely different modelling approach is to treat each pattern search as a competition between algorithms, with algorithms ranked by search time (fastest first). In this approach, the relative performance of each algorithm is ranked; there are 500 ranks for each pattern length. The fitted model can be used to calculate the probability, over all patterns, that algorithm A1 will be faster than algorithm A2.
Readers might be familiar with the Bradley-Terry model, where two items are ranked, e.g., the results from football games played between pairs of teams during a season. When more than two items are ranked, a Plackett-Luce model can be fitted. The output from fitting these models is a value,  , for each of the algorithms, e.g.,
  . The probability that algorithm
 A1 will rank higher than Algorithm A2 is calculated from the expression:
 , this expression can also be written as:
Switch A1 and A2 to calculate the opposite ranking.
The probability that algorithm A1 ranks higher than Algorithm A2 which in turn ranks higher than Algorithm A3 is calculated as follows (and so on for more algorithms):

For ease of comparison, only the 53 algorithms with 500 sets of timing data for all pattern lengths was fitted. The following plot shows the fitted values for each algorithm (blue/green lines are standard errors, and names containing HC are some variant of the authors’ hash chain technique; code+data):
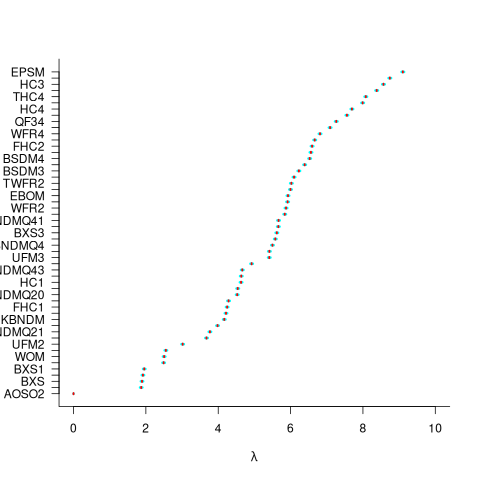
The EPSM algorithm makes use of the SSE and AVX instructions, supported by modern x86 processors, that can operate on up to 512 bits at a time.
The following table lists the fitted lambda values for the top eight ranked algorithm implementation:
 Algorithm    Lambda
      EPSM    9.103007
      THC3    8.743377
       HC3    8.567715
      FHC3    8.381220
      THC4    8.079716
      FHC4    7.991929
       HC4    7.695787
TWFR4 7.557796 |
The likelihood that EPSM will rank higher than THC3 is } right 0.59") .
.
This is better than random, and reflects the variability in algorithm performance, i.e., there is no clear winner.
It might be possible to extract more information from the data.
Some algorithms use of the same technique for part of their search process. Information on the techniques shared by algorithms can be added to the model as covariates. Assuming that a suitable fit is obtained, the model coefficients would indicate the relative impact of each technique on performance. I don’t know enough to select the techniques, and Matt is thinking about it.
Finding reports and papers on the web
What is the best way to locate a freely downloadable copy of a report or paper on the web? The process I follow is outlined below (if you are new to this, you should first ask yourself whether reading a scientific paper will produce the result you are expecting):
- Google search. For the last 20 years, my experience is that Google search is the best place to look first.
Search on the title enclosed in double-quotes; if no exact matches are returned, the title you have may be slightly incorrect (variations in the typos of citations have been used to construct researcher cut-and-paste genealogies, i.e., authors copying a citation from a paper into their own work, rather than constructing one from scratch or even reading the paper being cited). Searching without quotes may return the desired result, or lots of unrelated matched. In the unrelated matches case, quote substrings within the title or include the first author’s surname.
The search may return a link to a ResearchGate page without a download link. There may be a “Request full-text” link. Clicking this sends a request email to one of the authors (assuming ResearchGate has an address), who will often respond with a copy of the paper.
A search may not return any matches, or links to copies that are freely available. Move to the next stage,
- Google Scholar. This is a fantastic resource. This site may link to a freely downloadable copy, even though a Google search does not. It may also return a match, even though a Google search does not. Most of the time, it is not necessary to include the title in quotes.
If the title matches a paper without displaying a link to a downloaded pdf, click on the match’s “Cited by” link (assuming it has one). The author may have published a later version that is available for download. If the citation count is high, tick the “Search within citing articles” box and try narrowing the search. For papers more than about five years old, you can try a “Customer range…” to remove more recent citations.
No luck? Move to the next stage,
- If a freely downloadable copy is available on the web, why doesn’t Google link to it?
A website may have a robots.txt requesting that the site not be indexed, or access to report/paper titles may be kept in a site database that Google does not access.
Searches now either need to be indirect (e.g., using Google to find an author web page, which may contain the sought after file), or targeted at specific cases.
It’s now all special cases. Things to try:
- Author’s website. Personal web pages are common for computing-related academics (much less common for non-computing, especially business oriented), but often a year or two out of date. Academic websites usually show up on a Google search. For new (i.e., less than a year), when you don’t need to supply a public link to the paper, email the authors asking for a copy. Most are very happy that somebody is interested in their work, and will email a copy.
When an academic leaves a University, their website is quickly removed (MIT is one of the few that don’t do this). If you find a link to a dead site, the Wayback Machine is the first place to check (try less recent dates first). Next, the academic may have moved to a new University, so you need to find it (and hope that the move is not so new that they have not yet created a webpage),
- Older reports and books. The Internet Archive is a great resource,
- Journals from the 1950s/1960s, or computer manuals. bitsavers.org is the first place to look,
- Reports and conference proceedings from before around 2000. It might be worth spending a few £/$ at a second hand book store; I use Amazon, AbeBooks, and Biblio. Despite AbeBooks being owned by Amazon, availability/pricing can vary between the two,
- A PhD thesis? If you know the awarding university, Google search on ‘university-name “phd thesis”‘ to locate the appropriate library page. This page will probably include a search function; these search boxes sometimes supporting ‘odd’ syntax, and you might have to search on: surname date, keywords, etc. Some universities have digitized thesis going back to before 1900, others back to 2000, and others to 2010.
The British Library has copies of thesis awarded by UK universities, and they have digitized thesis going back before 2000,
- Accepted at a conference. A paper accepted at a conference that has not yet occurred, maybe available in preprint form; otherwise you are going to have to email the author (search on the author names to find their university/GitHub webpage and thence their email),
- Both CiteSeer and then Semantic Scholar were once great resources. These days, CiteSeer has all but disappeared, and Semantic Scholar seems to mostly link to publisher sites and sometimes to external sites.
Dead-tree search techniques are a topic for history books.
More search suggestions welcome.
Join a crowdsourced search for software engineering data
Software engineering data, that can be made publicly available, is very rare; most people don’t attempt to collect data, and when data is collected, people rarely make any attempt to hang onto the data they do collect.
Having just one person actively searching for software engineering data (i.e., me) restricts potential sources of data to be English speaking and to a subset of development ecosystems.
This post is my attempt to start a crowdsourced campaign to search for software engineering data.
Finding data is about finding the people who have the data and have the authority to make it available (no hacking into websites).
Who might have software engineering data?
In the past, I have emailed chief technology officers at companies with less than 100 employees (larger companies have lawyers who introduce serious amounts of friction into releasing company data), and this last week I have been targeting Agile coaches. For my evidence-based software engineering book I mostly emailed the authors of data driven papers.
A lot of software is developed in India, China, South America, Russia, and Europe; unless these developers are active in the English-speaking world, I don’t see them.
If you work in one of these regions, you can help locate data by finding people who might have software engineering data.
If you want to be actively involved, you can email possible sources directly, alternatively I can email them.
If you want to be actively involved in the data analysis, you can work on the analysis yourself, or we can do it together, or I am happy to do it.
In the English-speaking development ecosystems, my connection to the various embedded ecosystems is limited. The embedded ecosystems are huge, there must be software data waiting to be found. If you are active within an embedded ecosystem, you can help locate data by finding people who might have software engineering data.
The email template I use for emailing people is below. The introduction is intended to create a connection with their interests, followed by a brief summary of my interest, examples of previous analysis, and the link to my book to show the depth of my interest.
By all means cut and paste this template, or create one that you feel is likely to work better in your environment. If you have a blog or Twitter feed, then tell them about it and why you think that evidence-based software engineering is important.
Be responsible and only email people who appear to have an interest in applying data analysis to software engineering. Don’t spam entire development groups, but pick the person most likely to be in a position to give a positive response.
This is a search for gold nuggets, and the response rate will be very low; a 10% rate of reply, saying sorry not data, would be better than what I get. I don’t have enough data to be able to calculate a percentage, but a ballpark figure is that 1% of emails might result in data.
My experience is that people are very unsure that anything useful will be found in their data. My response has been that I am always willing to have a look.
I always promise to anonymize their data, and not release it until they have agreed; but working on the assumption that the intent is to make a public release.
I treat the search as a background task, taking months to locate and email, say, 100-people considered worth sending a targeted email. My experience is that I come up with a search idea or encounter a blog post that suggests a line of enquiry, that may result in sending half-a-dozen emails. The following week, if I’m lucky, the same thing might happen again (perhaps with fewer emails). It’s a slow process.
If people want to keep a record of ideas tried, the evidence-based software engineering Slack channel could do with some activity.
Hello,

A personalized introduction, such as: I have been reading
your blog posts on XXX, your tweets about YYY,
your youtube video on ZZZ.

My interest is in trying to figure out the human issues
driving the software process.

Here are two detailed analysis of Agile estimation data:
https://arxiv.org/abs/1901.01621
and
https://arxiv.org/abs/2106.03679

My book Evidence-based Software Engineering discusses what is
currently known about software engineering, based on an
analysis of all the publicly available data.
pdf+code+all data freely available here:
http://knosof.co.uk/ESEUR/

and I'm always on the lookout for more software data.
This email is a fishing request for software engineering data.

I offer a free analysis of software data, provided an
anonymised version of the data can be made public.
Fitting discontinuous data from disparate sources
Sorting and searching are probably the most widely performed operations in computing; they are extensively covered in volume 3 of The Art of Computer Programming. Algorithm performance is influence by the characteristics of the processor on which it runs, and the size of the processor cache(s) has a significant impact on performance.
A study by Khuong and Morin investigated the performance of various search algorithms on 46 different processors. Khuong The two authors kindly sent me a copy of the raw data; the study webpage includes lots of plots.
The performance comparison involved 46 processors (mostly Intel x86 compatible cpus, plus a few ARM cpus) times 3 array datatypes times 81 array sizes times 28 search algorithms. First a 32/64/128-bit array of unsigned integers containing N elements was initialized with known values. The benchmark iterated 2-million times around randomly selecting one of the known values, and then searching for it using the algorithm under test. The time taken to iterate 2-million times was recorded. This was repeated for the 81 values of N, up to 63,095,734, on each of the 46 processors.
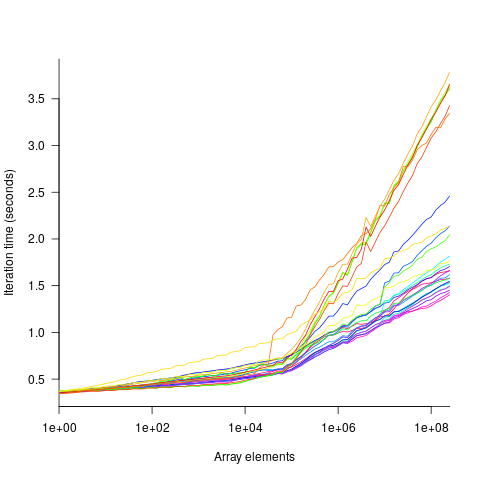
The plot below shows the results of running each algorithm benchmarked (colored lines) on an Intel Atom D2700 @ 2.13GHz, for 32-bit array elements; the kink in the lines occur roughly at the point where the size of the array exceeds the cache size (all code+data):
What is the most effective way of analyzing the measurements to produce consistent results?
One approach is to build two regression models, one for the measurements before the cache ‘kink’ and one for the measurements after this kink. By adding in a dummy variable at the kink-point, it is possible to merge these two models into one model. The problem with this approach is that the kink-point has to be chosen in advance. The plot shows that the performance kink occurs before the array size exceeds the cache size; other variables are using up some of the cache storage.
This approach requires fitting 46*3=138 models (I think the algorithm used can be integrated into the model).
If data from lots of processors is to be fitted, or the three datatypes handled, an automatic way of picking where the first regression model should end, and where the second regression model should start is needed.
Regression discontinuity design looks like it might be applicable; treating the point where the array size exceeds the cache size as the discontinuity. Traditionally discontinuity designs assume a sharp discontinuity, which is not the case for these benchmarks (R’s rdd package worked for one algorithm, one datatype running on one processor); the more recent continuity-based approach supports a transition interval before/after the discontinuity. The R package rdrobust supports a continued-based approach, but seems to expect the discontinuity to be a change of intercept, rather than a change of slope (or rather, I could not figure out how to get it to model a just change of slope; suggestions welcome).
Another approach is to use segmented regression, i.e., one of more distinct lines. The package segmented supports fitting this kind of model, and does estimate what they call the breakpoint (the user has to provide a first estimate).
I managed to fit a segmented model that included all the algorithms for 32-bit data, running on one processor (code+data). Looking at the fitted model I am not hopeful that adding data from more than one processor would produce something that contained useful information. I suspect that there are enough irregular behaviors in the benchmark runs to throw off fitting quality.
I’m always asking for more data, and now I have more data than I know how to analyze in a way that does not require me to build 100+ models 🙁
Suggestions welcome.
Recent Comments