Archive
Positive and negative descriptions of numeric data
Effective human communication is based on the cooperative principle, i.e., listeners and speakers act cooperatively and mutually accept one another to be understood in a particular way. However, when seeking to present a particular point of view, speakers may prefer to be economical with the truth.
To attract citations and funding, researchers sell their work via the papers they publish (or blogs they write), and what they write is not subject to the Advertising Standards Authority rule that “no marketing communication should mislead, or be likely to mislead, by inaccuracy, ambiguity, exaggeration, omission or otherwise” (my default example).
When people are being economical with the truth, when reporting numeric information, are certain phrases or words more likely to be used?
The paper: Strategic use of English quantifiers in the reporting of quantitative information by Silva, Lorson, Franke, Cummins and Winter, suggests some possibilities.
In an experiment, subjects saw the exam results of five fictitious students and had to describe the results in either a positive or negative way. They were given a fixed sentence and had to fill in the gaps by selecting one of the listed words; as in the following:
             all                      all
             most                     most                  right
In this exam .... of the students got .... of the questions .....
             some                     some                  wrong
none none |
If you were shown exam results with 2 out of 5 students failing 80% of questions and the other 3 out of 5 passing 80% of questions, what positive description would you use, and what negative description would you use?
The 60 subjects each saw 20 different sets of exam results for five fictitious students. The selection of positive/negative description was random for each question/subject.
The results found that when asked to give a positive description, most responses focused on questions that were right, and when asked to give a negative description, most responses focused on questions that were wrong
How many questions need to be answered correctly before most can be said to be correct? One study found that at least 50% is needed.
“3 out of 5 passing 80%” could be described as “… most of the students got most of the questions right.”, and “2 out of 5 students failing 80%” could be described as “… some of the students got most of the questions wrong.”
The authors fitted a Bayesian linear mixed effect models, which showed a somewhat complicated collection of connections between quantifier use and exam results. The plots below provide a visual comparison of the combination of quantifier use for positive (upper) and negative (lower) descriptions.
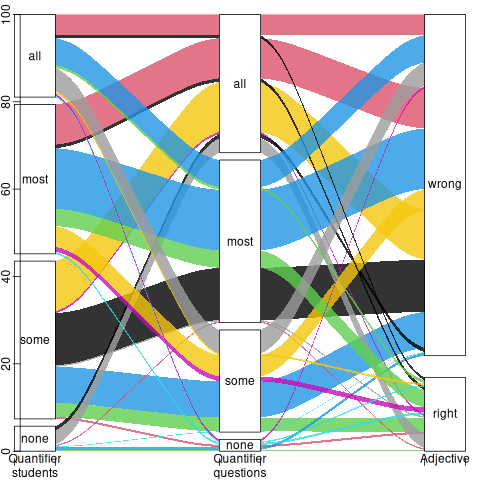
The alluvial plot below shows the percentage flow, for Positive descriptions, of each selected quantifier through student and question, and then adjective (code+data):

For the same distribution of exam results, the alluvial plot below shows the percentage flow, for Negative descriptions, of each selected quantifier through student and question, and then adjective (code+date):
Other adjectives could be used to describe the results (e.g., few, several, many, not many, not all), and we will have to wait for the follow-up research to this 2024 paper.
Number of parameters vs. accessing globals
I spend a lot of time looking at software engineering data, asking, what is the story here?
In a previous post I suggested that the distribution of the number of functions defined to have a given number of parameters, might be a signature of developer beliefs about the relative cost of parameter passing vs accessing globals.
Looking at the data that Iran Rodrigues Gonzaga Junior made available (good man), as part of his thesis Empirical Studies on Fine-Grained Feature Dependencies, I saw it contained information about the number of parameters in a function definition and whether functions accessed a global (Gonzaga’s research question is in another direction; I am always repurposing data).
Are functions that access globals, defined with fewer parameters, compared to those that do not contain any such access? The plot below shows a count of the number of functions defined to have a given number of parameters, for four systems written in C; the solid lines are functions that did not access globals, the dashed lines are functions that accessed globals (code+data).
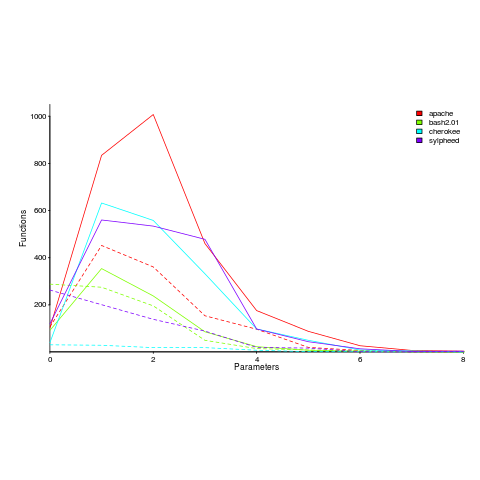
Over all 50 projects measured, functions that don’t access globals are defined, on average, to have an extra 0.7 parameters (the fitted Poisson regression models are better than a poke in the eye {i.e., the distribution is not really Poisson}, it’s more informative to look at the plotted data).
There is a lot of variation between projects (I picked these four because they were the larger projects and showed variation in behaviors). While the shape of the distributions varies a lot, there is always a noticeable difference in the mean.
Is this difference between projects a difference in developer beliefs, a difference in application requirements, a difference in developer coding habits (and parameter usage is a side effect; are there really that many getters and setters)?
I was hoping for a simple answer, and could not find one. Since I am writing a book and not researching individual issues in detail, it’s time to move on.
Ideas welcome.
Recent Comments