Archive
Decline in downloads of once popular packages
What happens to the popularity of Open source packages, measured in monthly downloads, once they cease to be updated or attract new users?
If the software does not have any competition within its domain, there is no reason why its popularity should decline. In practice, there are usually alternative packages offering the same or similar functionality. Even when alternatives are available, existing practice and sunk costs can slow migration. A year or so after I started using Asciidoc to write by Software Engineering book, the author announced that he was no longer going to update the software; initially there was no alternative, but the software did what I wanted, and I have been happily using it over the last 12 years.
The paper: Do All Software Projects Die When Not Maintained? Analyzing Developer Maintenance to Predict OSS Usage by Emily Nguyen measured the monthly downloads, commits and other characteristics of 38K GitHub packages having at least 10K downloads during any month between January 2015 and December 2020. The data made available (more here) is a subset, i.e., downloads for 1,583 projects starting in May 2015.
The author investigated the connection between various project characteristics (focusing on commits or lack thereof in particular) and downloads by fitting a Cox proportional hazards model.
The plot below shows the 67 monthly downloads for a selection of packages; the red line is a fitted local regression used to smooth the data (code and data):

Reasons for a decline from a peak number of downloads include: competition from alternative packages, change of fashion, and market saturation, or perhaps the peak was caused by a one-off event. Whatever the reason for a peak+decline, my interest is learning about patterns in the rate of decline.
Some of the monthly package downloads in the above plot have an obvious peak and decline, with others continually increasing, and others having multiple peaks. The following algorithm was used to select packages having a peak followed by a decline, based on the predicted values from a fitted loess model:
- find the month with the most downloads, this is the primary peak,
- if this month is within 10 months of the end of the measurement period, this is not a peak/decline package,
- does a secondary peak exist? A secondary peak is a month containing the most downloads from 10 months after the end of the primary peak, where the number of downloads is within 66% of the primary peak downloads,
- the secondary peak becomes the primary peak, provided it is not within 10 months of the end of the measurement period.
The final fraction of the primary peak is the average monthly download during the last three months divided by the peak month downloads.
The plot below shows the 693 packages whose final fraction of peak was below 0.6 against months from peak to the last month (at the end of 2020), with the red line showing a fitted regression of the form  (code and data):

As the above plot shows, there don’t appear to be any patterns in the decline of package downloads, and  is a poor predictor of fraction of peak.
Perhaps a more sophisticated peak+decline selection algorithm will uncover some patterns. Both ChatGPT (its generated python script failed) and Grok (very wrong answers) failed miserably at classifying the plots. Deepseek will only process images to extract text.
Program fault reports are caused by its users
Faults are generated by users of the software; no users, no fault reports. Fault reports will be generated for software that is free of coding mistakes; one study found that 42.6% of fault reports were misclassified as either requests for an enhancement, changes to documentation, or a refactoring request, or not requiring changes to the code; a study of NASA spaceflight software found that 63% of reports in the defect tracking tool were change requests.
Is the number of reported faults proportional to the number of users, the log of the number of users, or perhaps it depends on the application, or who knows what?
Some users will only use some features, others other features. Some users will be occasional users, while some will be heavy users.
There are a handful of fault report datasets containing measurements of software usage. The largest, and most widely cited, is “Optimizing Preventive Service of Software Products” by E. N. Adams. The data is this paper lists the number of faults reported in eight time intervals (20 to 50,000 months), for nine applications running on IBM mainframes between 1975 and 1980. Traditionally, the licensing for many Mainframe applications charge customers a fee based on their usage. Does this usage data still exist? Perhaps there is some sitting on a shelf in court documents. Pointers to possible cases most welcome.
Early papers on software testing sometimes measured the amount of cpu, or elapsed time, between each fault experience. However, the raw data was rarely published.
Data is available, for the Debian and Ubuntu distributions, on the number of installs for each application (counts rely on local machine sending information on installs, which is now an opt-in process for Ubuntu).
The following analysis uses data from the paper Impact of Installation Counts on Perceived Quality: A Case Study on Debian by Herraiz, Shihab, Nguyen, and Hassan, and the Ubuntu popularity project.
The plot below shows the number of reported faults against number of installs for the 14,565 programs in the “wheezy” Debian release; red line is the fitted power law:  (code+data):
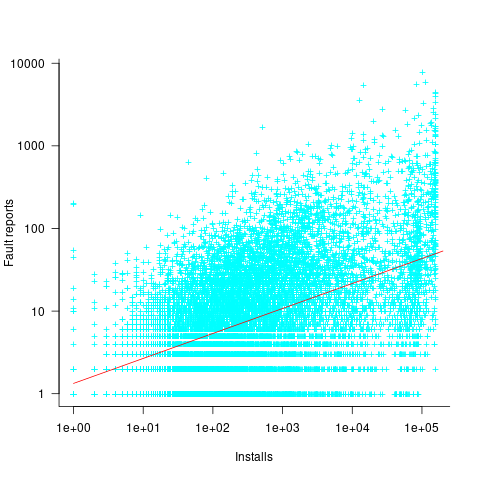
The huge variability in the number of fault reports for a given number of installs is likely driven by variability in the usage of the installed programs (or even no usage; I installed ImageMagick purely to use its convert program), the propensity of users of particular programs to report fault experiences (which in turn depends on the need for a fix, and the ease of reporting), and the number of coding faults in the source code.
The Debian installs/faults data does not include any usage information, however, the Ubuntu popularity data includes not only a count of installs, but the corresponding counts of regular users and non-usages. Given that Ubuntu is a fork of Debian, and has substantial usage, I’m assuming that the user base is sufficiently similar that the Ubuntu usage data at the time of the “wheezy” release can be applied to the “wheezy” Debian install/fault data.
The plot below shows, for 220,309 programs, the fraction of installs that are regularly used against the corresponding number of installs. The left-most line running top-left to bottom-right shows programs regularly used by one install, next line two regular users, etc (code+data):

Using the merged, by program name, Ubuntu usage/Debian fault counts, I built several regression models, along with plotting the data/fits. The quality of the models was worse than the original Debian model 🙁 . Two possibilities that spring to mind are: the correlation between usage and fault reports only becomes visible when the counts are divided into short periods (perhaps a year?), or the correlation is very weak. It is probably going to take a lot of time to work through this.
Research ideas for 2023/2024
Students sometimes ask me for suggestions of interesting research problems in software engineering. A summary of my two recurring suggestions, for this year, appears below; 2016/2017 and 2019/2020 versions.
How many active users does a program or application have?
The greater the number of users, the greater the number of reported faults. Estimates of program reliability have to include volume of usage as an integral part of the calculation.
Non-trivial amounts of public data on program usage is non-existent (in a few commercial environments, users are charged for using software on a per-usage basis, but this data is confidential). Usage has to be estimated by indirect means.
A popular indirect technique for estimating the popularity of Github repos is to count the number of stars it has; however, stars have a variety of interpretations. The extent to which Github stars tracks usage of the repo’s software is not known.
Other indirect techniques include: web server logs, installs of the application, or the operating system.
One technique that has not yet been researched is to make use of the identity of those reporting faults. A parallel can be drawn with the fish population in lakes, which is not directly visible. Ecologists have developed techniques for indirectly estimating the population size of distinct creatures using information about a subset of the population, and some of the population models developed for ecology can be adapted to estimating program user populations.
Estimates of population size can be obtained by plugging information on the number of different people reporting faults, and the number of reports from the same person into these models. This approach is not as easy as it sounds because sometimes the same person has multiple identities, reported faults also need to be deduplicated and cleaned (30-40% of reports have been found to be requests for enhancements).
Nested if-statement execution
As if-statement nesting depth increases, the number of conditions controlling the execution of the enclosed code increases.
Being able to estimate the likelihood of executing the code controlled by an if-statement is of interest to: compilers wanting to target optimizations along the most frequently executed paths, special handling for error paths, testing along the least/most likely paths (e.g., fuzzers wanting to know the conditions needed to reach a given block), those wanting to organize code for ease of understanding, by reducing cognitive effort to understand.
Possible techniques for analysing the likelihood of executing code controlled by one or more nested if-statements include:
- Compiler writers have discovered various heuristics for predicting the likely outcome of a branch, and there are probably more to be discovered. Statement coverage counts provides a ground truth against which to compare ideas,
- analysis of the conditional expression,
- mathematical analysis of the distribution of values of variables in conditional expressions.
Popularity of Open source Operating systems over time
Surveys of operating system usage trends are regularly published and we get to read about how the various Microsoft products are doing and the onward progress of mobile OSs; sometimes Linux gets an entry at the bottom of the list, sometimes it is just ‘others’ and sometimes it is both.
Operating systems are pervasive and a variety of groups actively track reported faults in order to issue warnings to the public; the volume of OS fault informations available makes it an obvious candidate for testing fault prediction models (e.g., how many faults will occur in a given period of time). A very interesting fault history analysis of OpenBSD in a paper by Ozment and Schechter recently caught my eye and I wondered if the fault time-line could be explained by the time-line of OpenBSD usage (e.g., more users more faults reported). While collecting OS usage information is not the primary goal for me I thought people would be interested in what I have found out and in particular to share the OS usage data I have managed to obtain.
How might operating system usage be measured? Analyzing web server logs is an obvious candidate method; when a web browser requests information many web servers write information about the request to a log file and this information sometimes includes the name of the operating system on which the browser is running.
Other sources of information include items sold (licenses in Microsoft’s case, CDs/DVD’s for Open source or perhaps books {but book sales tend not to be reported in the way programming language book sales are reported}) and job adverts.
For my time-line analysis I needed OpenBSD usage information between 1998 and 2005.
The best source of information I found, by far, of Open source OS usage derived from server logs (around 138 million Open source specific entries) is that provided by Distrowatch who count over 700 different distributions as far back as 2002. What is more Ladislav Bodnar the founder and executive editor of DistroWatch was happy to run a script I sent him to extract the count data I was interested in (I am not duplicating Distrowatch’s popularity lists here, just providing the 14 day totals for OS count data). Some analysis of this data below.
As luck would have it I recently read a paper by Diomidis Spinellis which had used server log data to estimate the adoption of Open Source within organizations. Diomidis researches Open source and was willing to run a script I wrote to extract the User Agent string from the 278 million records he had (unfortunately I cannot make this public because it might contain personal information such as email addresses, just the monthly totals for OS count data, tar file of all the scripts I used to process this raw log data; the script to try on your own logs is countos.sh).
My attempt to extract OS names from the list of User Agent strings Diomidis sent me (67% of of the original log entries did contain a User Agent string) provides some insight into the reliability of this approach to counting usage (getos.awk is the script to try on the strings extracted with the earlier script). There is no generally agreed standard for:
- what information should be present; 6% of UA strings contained no OS name that I knew (this excludes those entries that were obviously robots/crawlers/spiders/etc),
- the character string used to specify a given OS or a distribution; the only option is to match a known list of names (OS names used by Distrowatch,
missos.awkis the tar file script to print out any string not containing a specified list of OS names, the Wikipedia List of operating systems article), - quality assurance; some people cannot spell ‘windows’ correctly and even though the source is now available I don’t think anybody uses CP/M to access the web (at least 91 strings,
 %, would not have passed).
Ladislav Bodnar thinks that log entries from the same IP addresses should only be counted once per day per OS name. I agree that this approach is much better than ignoring address information; why should a person who makes 10 accesses be counted 10 times, a person who makes one access is only counted once. It is possible that two or more separate machines running the same OS are accessing the Internet through a common gateway that results in them having the IP address from an external server’s point of view; this possibility means that the Distrowatch data undercounts the unique accesses (not a serious problem if most visitors have direct Internet access rather than through a corporate network).
The Distrowatch data includes counts for all IP address and from 13 May 2004 onwards unique IP address per day per OS. The mean ratio between these two values, summed over all OS counts within 14 day periods, is 1.9 (standard deviation 0.08) and the Pearson correlation coefficient between them is 0.987 (95% confidence interval is 0.984 to 0.990), i.e., almost perfect correlation.
The Spinellis data ignores IP address information (I got this dataset first, and have already spent too much time collecting to do more data extraction) and has 10 million UA strings containing Open source OS names (6% of all OS names matched).
How representative are the Distrowatch and Spinellis data? The data is as representative of the general OS population as the visitors recorded in the respective server logs are representative of OS usage. The plot below shows the percentage of visitors to Distrowatch that use Ubuntu, Suse, Redhat. Why does Redhat, a very large company in the Open source world, have such a low percentage compared to Ubuntu? I imagine because Redhat customers get their updates from Redhat and don’t see a need to visit sites such as Distrowatch; a similar argument can be applied to Suse. Perhaps the Distrowatch data underestimates those distributions that have well known websites and users who have no interest in other distributions. I have not done much analysis of the Spinellis data.
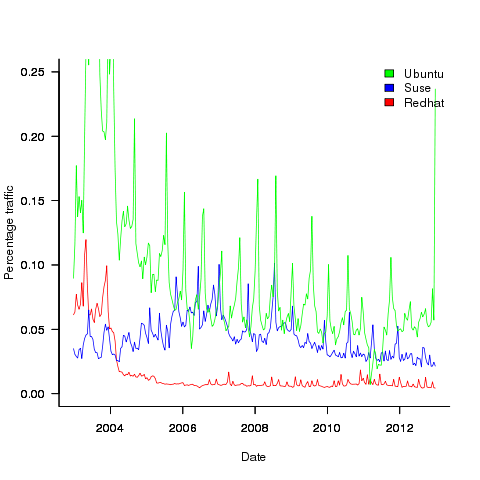
Presumably the spikes in usage occur around releases of new versions, I have not checked.
For my analysis I am interested in relative change over time, which means that representativeness and not knowing the absolute number of OSs in use is not a problem. Researchers interested in a representative sample or estimating the total number of OSs in use are going to need a wider selection of data; they might be interested in the following OS usage information I managed to find (yes I know about Netcraft, they charge money for detailed data and I have not checked what the Wayback Machine has on file):
- Wikimedia has OS count information back to 2009. Going forward this is a source of log data to rival Distrowatch’s, but the author of the scripts probably ought to update the list of OS names matched against,
- w3schools has good summary data for many months going back to 2003,
- statcounter has good summary data (daily, weekly, monthly) going back to 2008,
- TheCounter.com had data from 2000 to 2009 (csv file containing counts obtained from Wayback Machine).
If any reader has or knows anybody who has detailed OS usage data please consider sharing it with everybody.
O Cobol, Cobol! wherefore art thou Cobol?
Programming language popularity has been in the news again and as always Cobol is nowhere to be seen in the rankings. Even back in the day, when people in the know generally considered Cobol to be the most widely used language it often failed to appear, or appeared very low down, in language rankings. I think Cobol’s unrepresentative rankings occur because users of Cobol are assumed to hang out in the same places as users of other programming languages. The letters bo in the name is the clue, business oriented people are not usually interested in technical stuff and tend not to read the magazines (and these days web sites) that users of the other popular languages read.
Cobol is very business domain specific and does not contain functionality that makes it a reasonable choice for writing applications in other domains (it is possible to write a compiler in Cobol, for instance the Micro Focus compiler is written in Cobol). It has very sophisticated languages constructs for handling data having the most convoluted formats imaginable, essential in the business world which has to process data whose format has evolved over the years into a tangled mess (developers have to deal with spaghetti code, business has to deal with spaghetti data formats). Cobol’s control flow and code structuring facilities are primitive (all variables are global and the perform statement is very similar to the gosub statement found in Basic’s that are line number based) because business data processing tends to be relatively simple and programs to handle them are generally small (the large Cobol programs of legend are invariably made up of lots of small programs run in series with complicated data format dependencies between them).
I started to realise just how different Cobol is when working on my first Cobol code generator (yes it was written in Cobol). If a processor has lots of registers it is usually worthwhile to dedicate one to holding the value zero (of the 32 registers supported by most RISC processors, often only 31 can hold different values, one is dedicated to returning zero when read from and ignores any value written to it), in the case of Cobol it is considered worthwhile to dedicate a register to hold 0x20202020 (four space characters) rather than zero.
Is Cobol still the most widely used language today? No, I don’t think so. Business people love spreadsheets which means developers have switched to writing pre/post data format processing code, previously in Cobol, in Visual Basic (to convert input data into a form accepted by the spreadsheet and then print the results of the spreadsheet calculations in a presentable format); this Visual Basic source can often have a Cobol-like feel to it. This spreadsheet usage also resulted in the comma separated list becoming a widely used format for data representation, eroding Cobol’s unique selling point of sophisticated input/output data format processing.
What does language popularity mean? Does using a language you don’t like count towards it being popular? There are several languages I like and very rarely get to use, does this mean I don’t get to contribute to their popularity?
In these tough financial times the number of job adverts requiring knowledge of a specified language is probably of more interest than number of posts to web sites. One job search site lists 3,032 Cobol jobs and counting job ad hits for the top languages listed in a recent popularity poll puts Cobol at the bottom end of the cluster of highest ranked languages.
On mainframes I think Cobol is likely to still be No. 1; it is probably impossible to replace the dominant language in a niche market.
Recent Comments