Archive
Warp your data to make it visually appealing
Data plots can sometimes look very dull and need to be jazzed up a bit. Now, nobody’s suggesting that the important statistical properties of the data be changed, but wouldn’t it be useful if the points could be moved around a bit, to create something visually appealing without losing the desired statistical properties?
Readers have to agree that the plot below looks like fun. Don’t you wish your data could be made to look like this?

Well, now you can (code here, inspired by Matejka and Fitzmaurice who have not released their code yet). It is also possible to thin-out the points, while maintaining the visual form of the original image.
The idea is to perturb the x/y position of very point by a small amount, such that the desired statistical properties are maintained to some level of accuracy:
check_prop=function(new_pts, is_x)
{
if (is_x)
   return(abs(myx_mean-stat_cond(new_pts)) < 0.01)
else
   return(abs(myy_mean-stat_cond(new_pts)) < 0.01)
}


mv_pts=function(pts)
{
repeat
   {
   new_x=pts$x+runif(num_pts, -0.01, 0.01)
   if (check_prop(new_x, TRUE))
      break()
   }

repeat
   {
   new_y=pts$y+runif(num_pts, -0.01, 0.01)
   if (check_prop(new_y, FALSE))
      break()
   }

return(data.frame(x=new_x, y=new_y))
} |
The distance between the perturbed points and the positions of the target points then needs to be calculated. For each perturbed point its nearest neighbor in the target needs to be found and the distance calculated. This can be done in  using kd-trees and of course there is an R package, RANN, do to this (implemented in the
 nn2 function). The following code tries to minimize the sum of the distances, another approach is to minimize the mean distance:
mv_closer=function(pts)
{
repeat
   {
   new_pts=mv_pts(pts)
   new_dist=nn2(rabbit, new_pts, k=1)
   if (sum(new_dist$nn.dists) < cur_dist)
      {
      cur_dist <<- sum(new_dist$nn.dists)
      return(new_pts)
      }
   }

} |
Now it’s just a matter of iterating lots of times, existing if the distance falls below some limit:
iter_closer=function(tgt_pts, src_pts)
{
cur_dist <<- sum(nn2(tgt_pts, src_pts, k=1)$nn.dists)
cur_pts=src_pts
for (i in 1:5000)
   {
   new_pts=mv_closer(cur_pts)
   cur_pts=new_pts
   if (cur_dist < 13)
      return(cur_pts)
   }
return(cur_pts)
} |
This code handles a single statistical property. Matejka and Fitzmaurice spent more than an hour on their implementation, handle multiple properties and use simulated annealing to prevent being trapped in local minima.
An example, with original points in yellow:
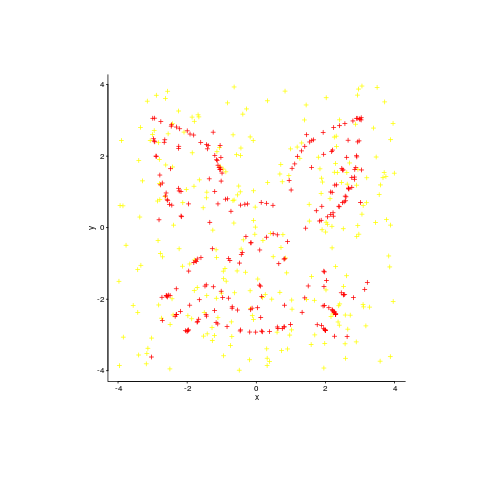
Enjoy.
I have been reading your interesting paper
In the last six years or so I have sent around 420 emails whose first line started: “I have been reading your interesting paper”, followed a few lines later by: “Would it be possible to obtain a copy of the data?”, and then some background and links to blog posts and my previous book.
The response break down is roughly as follows:
Received data 136 32% No reply 132 32% Pending (received a positive reply) 49 12% Confidential 42 10% No longer have the data 20 5% Best known address bounces 11 3% |
Thanks to those 136 researchers who took the time to collect together their data and send me a copy.
The “No reply” response get a second email 6-9 months after the first. I’m hoping that the availability of a draft of the book will generate some positive publicity that reminds researchers they have had an email from me and are missing out.
The “Confidential” case is relatively low because it is often obvious that the data is confidential and I don’t bother asking for a copy (I only use data that can be made public).
A common reason behind “No longer have the data” is a change of laptop and sometimes a change of jobs. If the paper is more than five years old, I tend not to ask unless the data looks very interesting. Mine and others’ experiences show that research data has a relatively short half-life.
I try quite hard to find a workable address, sometimes emailing supervisors and going via LinkedIn.
Software Reliability: Lots of detailed data and thoughtful analysis
The 1978 book “Software Reliability” by Thayer, Lipow and Nelson is the only wide-ranging publicly available source of detailed software development project data that I am aware of. While analysis of Open Source, which started around 10 years ago, has added much more detail in some areas it has added almost nothing in other areas (e.g., manpower and requirements data). The analysis in this book is also very thorough, making good use of the statistical techniques available back in the day.
A few weeks ago I found an online pdf of the report from which the book is very closely derived. Anyone interested in software engineering should read this report, I’m not sure much of the state of the art has progressed that much since its publication in 1976.
The pdf was created from a microfiche copy of the original document and the numbers in some tables are illegible. I have photographed, in my copy of the book, the tables containing numbers printed using a small point size and you can download the jpegs (I don’t have the time to transcribe them to ascii text; please let me know if you do this).
Why did this book/report rapidly disappear into almost total obscurity? Perhaps it contained too much data and did too good a job of analysing it, compared to what came soon after it. Perhaps because it did not have a champion to sing its praises (wanting to build a personal career can have benefits for those other than the person doing the building).
Word length lexical decision data
Well chosen identifier names can reduce the effort needed to understand the code containing them, compared to badly chosen identifiers.
An identifier might have a name that creates a semantic association in the mind of the reader about the role of the variable within a function definition (e.g., outer_counter) or an association with the information contained in the variable (e.g., max_fruit).
Code is not always read like prose text, developers might quickly scan through the source looking for something. In this case short identifier names are best because it reduces the number of characters that need to be scanned.
If you want to make life difficult for anyone who has to read your code, add a visually boring common prefix to every identifier, e.g., uacc. Readers start looking up a word in memory based in the first few characters while they process the remaining characters in a word, and eye tracking studies have found that that character sequence information is used to plan eye saccades (where to move the eyes next). A short bland sequence can really throw a spanner in the works of our over-learned reading skills.
I once researched a detailed analysis of the issues involved in a cost/benefit analysis of identifier selection. The good news is that I think I covered everything, the bad news is that the various kinds of data on human character sequence usage needed to perform the analysis was/is not available.
Today I got my hands on lots of performance data on the affect of word length on visual word recognition; thanks to Boris New (code and data)
The plot below shows the mean response time of 819 subjects performing a lexical decision task (respond yes/no on whether a character sequence is a word or nonword); each subject was tested on a subset of around 3,000 out of 33,608 words.
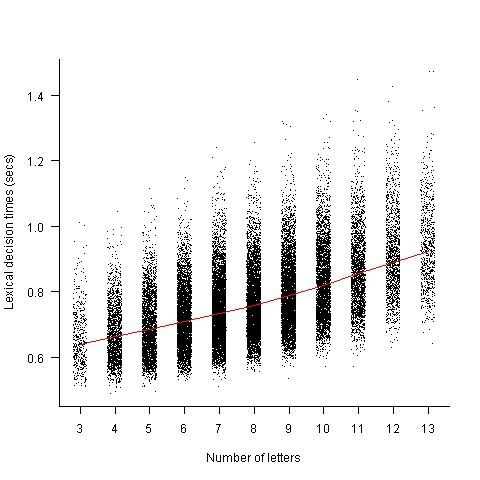
Note, this data is for single words. There are bound to be all sorts of interaction effects when two words/nonwords occur together in an identifier, e.g., semantic priming.
Word length is only one of several factors that have been found to effect people’s performance in processing words; others include the word frequency effect and age of acquisition (when the word was learned, which is correlated with word frequency).
Have fun with this.
Workshop on analyzing software engineering data
I am teaching a workshop, analyzing software engineering data, on 16 January 2016. If you meet the assumed level of know-how (basic understanding of maths to GCSE level, fluent in at least one programming language {i.e., written 10k+ lines of code} and will turn up with a laptop that has R installed), then you are welcome to sign up, its free. The event is being organized by ACCU London.
The focus is on extracting information that is useful to practicing software developers for creating software systems; statistics is used as a tool to find patterns in the data (R is used for this and the programs have the form: read_data(); format_data(); appropriate_statistical_function(); plot_results() and are usually contained in 10-30 lines).
The maths/programming requirements are there because the focus is on the software engineering ideas implied by the data; people need to implicitly understand how an equation fits together (not because there will be lots of algebra, there isn’t) and to be able to pick up and use a new language quickly.
The material is based on a book I am working on.
Its a hands-on workshop, with me talking for an hour or so and then everybody analyzing data for an hour, repeating until end-of-day. I have plenty of data for you to work on, but if you do have some software engineering data that you are willing to share with everybody, please bring it along.
The workshop is something of an experiment; as far as I know there are no books or courses aimed at software developers interested in analyzing software engineering data (there are a few books containing an assortment of academic papers). If the material is too easy I can speed up, if it is too hard then I will slow down; if the material is of no practical use we can all leave early.
The plan is to start at the beginning and cover all the important topics in software engineering. Obviously this requires more than a one day workshop. If there is enough interest there will be more workshops covering different topics (assuming I have time to organize the material and an available venue permitting).
MyFloodPlan: The personalized flood plan App
I took part in the HackTheTownHall flood-relief hackathon at the weekend. Team MyFloodPlan (me, Manoj, Lusine, Anthony and Sanjeet) built an App (try it) that created personalised flood plans; tell us where you live and we tell you number of hours before the flood water reaches you, plus providing a list of recommended actions for that time frame, with the timing of the recommended actions being influenced by personal circumstances such as age (older people likely to take longer to do things than younger people), medical situation and risk aversion. The App has five prespecified users at various locations in the worst hit flooding areas around west London in February 2014. UK Government recommendations are basically to move things to higher ground (e.g., upstairs) and just as the water arrives at your door turn off the gas and electric.
The App used the Ordnance Survey Terrain 50 data (height above sea level of 50 meter squares covering the whole UK and accurate to 0.01 0.1 meters) to find the difference in height between the user’s location and the last reported local flood height (we faked this number), multiplied this by how fast the flood water is rising (we picked 100 10 cm per hour) to find out how many minutes it would take for the flood to reach the user’s location. In practice it would be easy to get the current flood height, the user could simply walk to the current edge of the flood and tell the App where it was; data on rate of height increase/decrease could come from the Environment agency flood warning site.
The Ordnance survey has height data at 5 meter square resolution and supplied a sample for an area near Bristol. The accuracy of GPS is nowhere near good enough for obtaining height data. Altitude data for most of the world is available thanks to the Shuttle Radar Topography Mission; the grid resolution is 30 meters in the US and 90 meters outside the US.
I thought of creating a 2-D equation that interpolated between all known points (using say, cubic splines), this would smooth out height discontinuities and probably improve the estimates for most locations. But given the large unknowns in rate of change of flood water height, interpolation seemed like over-kill (given how smooth the data is over much of the UK this approach might be away of reducing data storage/access).
The big unknown in all of this is modeling changes in flood water level. In February there were announcements that gave maximum levels. The ideal situation is for the Environment agency to provide a predicted flood water level time line API. They probably have the predictions, but given the degree of uncertainties present in all models I would understand any reluctance in making this information available in real time.
On the ground monitoring the progress of a flood would only take a few people on bikes to cover a whole town, reporting back to a local system that kept everybody updated. Real-time flood level tracking is not a big data problem (prediction and maintaining historical data are) and a handful of people using modest computer resources could easily provide a personalized flood warning service to locals.
Team MyFloodPlan was made up of Team prompt Parking (minus Bob), from a previous hackathon, plus two other people, and these provided a useful reminder of the mindset needed for a hackathon. Producing a working App in 24 hours requires keeping things simple and doing what needs to be done; sometimes outrageous simplifications have to be made and the most awful coding solutions have to be lived with. Our two new members (a business consultant and very clever technical guy) were into considering all the issues and how they connected, and looking to keep all potential customers happy; all good stuff to do when there is plenty of time and resources available, but fatal mistakes in a short hackathon. We spent all day going in circles around the original idea (team Prompt Parking are very laid back and prone to gossiping about tech with anybody who happens to wonder by), when the two left for the night the circling died down and within a few hours we had the basic core of the App coded and working.
The oversimplifications made by team PromptParking, along with our willingness to ignore ‘low volume’ customers left our two newbies exasperated and baffled. However, the aim is to produce the best minimum viable product, not an impressive report covering all the issues
How can flood data be monetized using an App? Floods are too rare for the MyFloodPlan App to provide a regular income. Perhaps during a flood it could cheer people up by displaying adds for holidays in sunny destinations, provide suggestions for new furniture, decorating ideas, etc and if the flood had not yet reached them the best place to sell their home.
The best money making App I could think of was one that provides flooding information to potential home buyers. The DoesThisLocationFlood App would show pictures of previous floods in the area (picture gathering would be so much easier if Twitter did not remove location information from posted pictures), along with height above local water features and distance from them. It would be great to tie in with online home purchase sites, but these make money from the seller and so are unlikely to see any added value in the DoesThisLocationFlood App.
The MyFloodPlan App came second, beaten by an App that allowed users to report and see events in a flood affected area (and made great use of text messaging). Our App was not very interactive, i.e., flood arrives in x hours, do these things. We should have been more adventurous; having been gone down the route planning rabbit hole before I shied away from figuring out which road were flooded and suggesting alternative routes (the route planners in OpenStreetMap do seem to be improving).
Thanks to Milverton for organizing the event and the knowledgeable and helpful people from the Environment agency and Ordnance survey.
A request for future events: A method of turning off the lights so people don’t have to sleep under the tables to stop the motion detectors turning the lights on.
Empirical SE groups doing interesting work, 2013 version
Various people have asked me about who is currently doing interesting work in empirical software engineering and the following is an attempt to help answer this question. Interestingness is very subjective, in my case it is based on whether I think the work can contribute something towards my book on empirical software engineering.
To keep this list manageable I am restricting myself to groups of researchers (a group is two or more people) and giving priority to those who make their data publicly available.
Some background for those with no experience of academic research. Over a period of 4-5 years a group can go from having published nothing on a research topic to publishing some very interesting stuff to not publishing anything on the topic. Reasons for this include funding appearing/disappearing, the arrival/departure of very productive people (departure may be to other jobs or moving from research into management), or the researcher loosing interest and moving onto other things. A year from now any of the following groups may be disbanded or moved on to other research areas.
The conferences to check out are: Mining Software Repositories, Source Code Analysis and Manipulation, perhaps 1 in 2.5 of CREST Open Workshop and International Conference on Software Maintenance.
General sources of raw data include: promisedata and FLOSSmole is a firehose of bytes.
Who is the biggest group of researchers? In my mind it is the Canadians (to be exact the groups at Queen’s and Waterloo and the Ptidel project), now the empirical group at Microsoft would probably point out that they are not separated by several hundred miles and all work for the same company; this may be true but looking from Europe the Canadians look real close to each other on a map and all share a domain name ending in ca. In practice members of all three groups write papers together and spend time visiting/interning with each other. Given how rapidly things change I am not going to bother calculating an accurate number 1 for today.
Around the world (where there is no group page to link to I have used an individual’s page):
UK (theory in groups, practice by individuals; Brunel would warrant a link if they put some effort into maintaining a web presence and made their data available for download; come on guys)
USA (Devanbu, Grechanik, Kemerer, Menzies, SEMERU + TODO; Binkley for identifier semantics)
Some researchers leave a group to set up their own group and I know that some people in the above lists have done this. I wish them luck. If their group starts publishing interesting stuff they will be on any future version of this list.
Sitting here typing away I have probably missed out some obvious candidates. Pointers to obvious omissions welcome (remember this is about groups not individuals).
Update: Groups in 2021
US DoD software development data now available
I found a huge resource of software development data last weekend at the Defense Cost and Resource Center (DCARC). The Software Resource Data Report part of this resource contains information on around 2,000 major software development projects (any US DOD project over $20 million+) giving details of schedule, developer experience, money spent per year, lines of code, amount of code change, hours spent on at various stages of development and a whole lot more.
The catch? The raw data is only available to DoD analysts 🙁 I was a bit surprised that laws got passed mandating the collection of this kind of information and a lot less surprised that the DoD don’t want to make detailed development information for missile systems, radar installations, etc available to some interested parties; those of us who are not going to go out and build such systems are collateral damage.
What is the US government’s reason for requiring the collection and dissemination of this information? They want to reduce the huge amount of money currently being spent on the software development component of military systems (often a very large slice of the total project costs). Will having this data available reduce costs? It will certainly get project managers a lot more worried about project cost/time overruns if they know that lots of people outside the project are going to see their ‘failure’.
Hopefully there are Open data activists in the US who will push for a redacted form of the software data being made available to all interested parties, rather like that provided by the USA Spending site. In the meantime there are a few lucky DoD analysts who have gone from famine to feast and are probably having trouble figuring out where to start.
Update
The military like to rename things, and move stuff around. We now have: Cost Assessment Data Enterprise, with its software data.
Recent Comments