Archive
How has the price of a computer changed over time?
We are told that computers are now orders of magnitude cheaper than they once were. Computers have changed an awful lot over the last 70 years; how is the functionality supported by different computers normalised such that the price of computers from long ago can be compared with today’s computers?
One approach is to narrow the question down to calculating the cost of performing some basic operation, e.g., numerical calculation or sorting a list of values. Nordhaus’s famous paper: Two Centuries of Productivity Growth in Computing uses this approach.
The primary advantage of the cost-of-operation approach is that it can be made to work across the complete range of computing platforms. The major disadvantage of this approach is that it focuses on the performance of the cpu/memory, ignoring the ability to store large amounts of data and perform I/O (which is most of the cost of some computer systems).
The US consumer price index (CPI) uses Hedonic regression to adjust the average price of a product family whose quality changes over time (the CPI is used to track inflation, and so every price needs to be for a product identical to the exemplar chosen at some start date). Hedonic pricing models are also used to understand how specific features within a product category (e.g., housing, automobiles, or electronics) contribute to the price. The term hedonic is derived from hedonism, and was first used in a 1939 paper analysing the price/quality of automobiles.
The 1979 paper “Hedonic Prices and the Structure of the Digital Computer Industry” by R. Michaels (cannot find a downloadable copy) appears to have kick-started the computer/hedonic research rabbit hole (the 1969 book “The Economics of Computers” by W. F. Sharpe covers computer costings in detail). Hedonic regression estimates the value of a product by braking it down into its major components which are used as the explanatory variables in a regression model that predicts the product price on given dates, e.g., for mainframe computers: price, cpu speed, amount of memory, number/size of hard disks, number of tape drives and card readers.
While mainframes and microcomputers share some characteristics (e.g., cpu, memory, and discs), they address different markets with very different requirements (e.g., mission-critical requires high reliability and tape backups). Different Hedonic regression models need to be fitted for each.
Gathering a representative sample of information on all the major components of a product, preferably for each year, is a lot of work. Many papers make use of information from proprietary databases. A lot of historical information is now available in scanned trade publications, but LLMs are not yet good enough to reliably extract detailed information from scanned documents (e.g., they sometimes ignore information, rather than hallucinating). I am waiting for the error rate to decrease.
The analysis in the book chapter Computer Processors and Peripherals by R. J. Gordon spends a lot of time dealing with the issues around potentially inconsistent data sources. The final price index (table 6.7) shows that the normalised price of mainframes decreased by a factor of 922 between 1951 and 1983 (23% per year, for 33 years). That is, the equivalent 1951 mainframe purchased in 1983 would have been cheaper by a factor of 922. In practice, prices did not decrease by a factor of 922, rather some combination of price/quality of the average mainframe changed by this factor (where quality is some combination of faster cpus, more memory and other factors). For an analysis of computer related products see the book “Price Measurements and Their Uses” by Foss, Manser, and Young.
The price of microcomputers (or computers as we call them today, as there is little public perception of any other type of computer) has decreased, but by how much (in the Hedonic sense)?
The first Hedonic analysis of microcomputers was Cohen’s 1988 Master’s thesis, for personal computers between 1976 and 1987. I think Cohen is pushing product family boundaries to treat the 8-bit computers introduced before the IBM PC in August 1981 (which did not include a hard disk until 1983, and did not really become a 16-bit computer until the IBM AT in 1987) as being comparable with later microcomputers. Cohen’s analysis found positive/negative swings in the adjusted prices of the microcomputers.
The paper Price and quality of desktop and mobile personal computers: A quarter-century historical overview by Berndt, Dulberger and Rappaport claim that there was an average annual 27% decline in microcomputer prices between 1976 and 1999. Again, my comments on pre-1987 microcomputers applies. A later paper (appendix table 1) shows average actual prices increasing until 1991 and decreasing thereafter, with the averages of cpu frequency, memory capacity and hard disk size continually increasing. There was little difference in the prices at the start(1976)/end(2002) of the period analysed, but a huge difference in the quality characteristics. While writing my Evidence-based software engineering book, I emailed Berndt for the data, which a co-author kindly made available. Unfortunately, I found that much of the data was confidential (the name of a company that sold computer sales data appeared in the files), and could not be publicly shared 🙁
Hedonic analysis of computers appears to have become unfashionable around the start of 2000. More recent papers analyse products such as mobile phones and cloud services. Please leave a comment if you know of any recent hedonic analysis of computer prices.
The only detailed microcomputer price data I know of consists of 6,259 detailed prices collected by Stengos, and Zacharias over 35 months, starting in January 1993, from the adverts in PC Magazine.
The units of measurement for software reliability
How do the people define software reliability? One answer can be found by analyzing defect report logs: one study found that 42.6% of fault reports were requests for an enhancement, changes to documentation, or a refactoring request; a study of NASA spaceflight software found that 63% of reports in the defect tracking system were change requests.
Users can be thought of as broadly defining software reliability as the ability to support current (i.e., the software works as intended) and future needs (i.e., functionality that the user does not yet know they need, e.g., one reason I use R, rather than Python, for data analysis, is because I believe that if a new-to-me technique is required, a package+documentation supporting this technique is more likely to be available in R).
Focusing on current needs, the definition of software reliability depends on the perspective of who you ask, possibilities include:
- commercial management: software reliability is measured in terms of cost-risk, i.e., the likelihood of losing an amount £/$ as a result of undesirable application behavior (either losses from internal use, or customer related losses such as refunds, hot-line support, and good will),
- Open source: reliability has to be good enough and at least as good as comparable projects. The unit of reliability might be fault experiences per use of the program, or the number of undesirable behaviors encountered when processing pre-existing material,
- user-centric: mean time between failure per uses of the application, e.g., for a word processor, documents written/edited. For compilers, mean time between failure per million lines of source translated,
- academic and perhaps a generic development team: mean time between failure per million lines/instructions executed by the application. The definition avoids having to deal with how the software is used,
- available data: numeric answers require measurement data to feed into a calculation. Data that is relatively easy to collect is cpu time consumed by tests that found some number of faults, or perhaps wall time, or scraping the bottom of the barrel the number of tests run.
If an organization wants to increase software reliability, they can pay to make the changes that increase reliability. Pointing this fact out to people can make them very annoyed.
Hardware/Software cost ratio folklore
What percentage of data processing budgets is spent on software, compared to hardware?
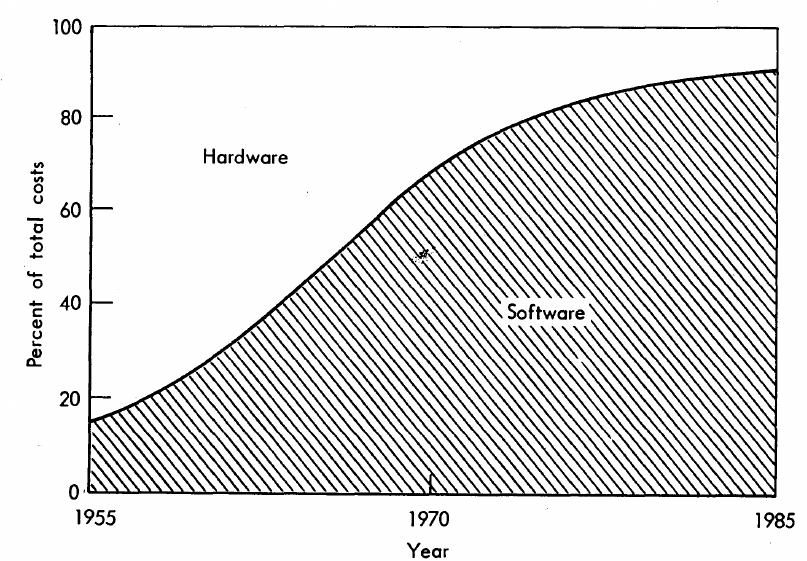
The information in the plot below quickly became, and remains, the accepted wisdom, after it was published in May 1973 (page 49).
Is this another tale from software folklore? What does the evidence have to say?
What data did Barry Boehm use as the basis for this 1973 article?
Volume IV of the report Information processing/data automation implications of Air-Force command and control requirements in the 1980s (CCIP-85)(U), Technology trends: Software, contains this exact same plot, and Boehm is a co-author of volume XI of this CCIP-85 report (May 1972).
Neither the article or report explicitly calls out specific instances of hardware/software costs. However, Boehm’s RAND report Software and Its Impact A Quantitative Assessment (Dec 1972) gives three examples: the US Air Force estimated they will spend three times as much on software compared to hardware (in early 1970s), a military C&C system ($50-100 million hardware, $722 million software), and recent NASA expenditure ($100 million hardware, $200 million software; page 41).
The 10% hardware/90% software division by 1985 is a prediction made by Boehm (probably with others involved in the CCIP-85 work).
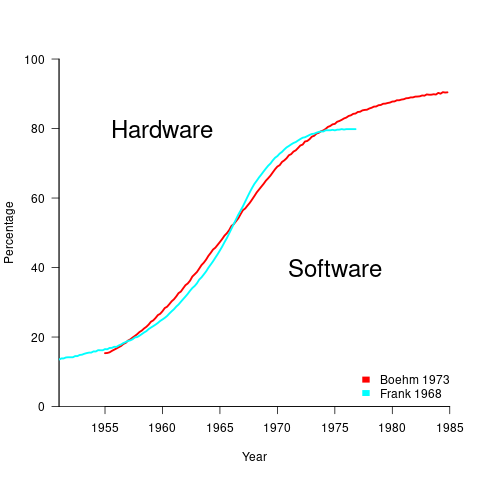
What is the source for the 1955 percentage breakdown? The 1968 article Software for Terminal-oriented systems (page 30) by Werner L. Frank may provide the answer (it also makes a prediction about future hardware/software cost ratios). The plot below shows both the Frank and Boehm data based on values extracted using WebPlotDigitizer (code+data):
What about the shape of Boehm’s curve? A logistic equation is a possible choice, given just the start/end points, and fitting a regression model finds that  is an almost perfect fit (code+data).
How well does the 1972 prediction agree with 1985 reality?
At the start of the 1980s, two people wrote articles addressing this question: The myth of the hardware/software cost ratio by Harvey Cragon in 1982, and The history of Myth No.1 (page 252) by Werner L. Frank in 1983.
Cragon’s article cites several major ecosystems where recent hardware/software percentage ratios are comparable to Boehm’s ratios from the early 1970s, i.e., no change. Cragon suggests that Boehm’s data applies to a particular kind of project, where a non-recurring cost was invested to develop a new software system either for a single deployment or with more hardware to be purchased at a later date.
When the cost of software is spread over multiple installations, the percentage cost of software can dramatically shrink. It’s the one-of-a-kind developments where software can consume most of the budget.
Boehm’s published a response to Cragon’s article, which answered some misinterpretations of the points raised by Cragdon, and finished by claiming that the two of them agreed on the major points.
The development of software systems was still very new in the 1960s, and ambitious projects were started without knowing much about the realities of software development. It’s no surprise that software costs were so great a percentage of the total budget. Most of Boehm’s articles/reports are taken up with proposed cost reduction ideas, with the hardware/software ratio used to illustrate how ‘unbalanced’ the costs have become, an example of the still widely held belief that hardware costs should consume most of a budget.
Frank’s article references Cragon’s article, and then goes on to spend most of its words citing other articles that are quoting Boehm’s prediction as if it were reality; the second page is devoted 15 plots taken from these articles. Frank feels that he and Boehm share the responsibility for creating what he calls “Myth No. 1” (in a 1978 article, he lists The Ten Great Software Myths).
What happened at the start of 1980, when it was obvious that the software/hardware ratio predicted was not going to happen by 1985? Yes, obviously, move the date of the apocalypse forward; in this case to 1990.
Cragon’s article plots software/hardware budget data from an uncited Air Force report from 1980(?). I managed to find a 1984 report listing more data. Fitting a regression model finds that both hardware and software growth is deemed to be quadratic, with software predicted to consume 84% of DoD budget by 1990 (code+data).
Did software consume 84% of the DoD computer/hardware budget in 1990? Pointers to any subsequent predictions welcome.
Estimating the yearly spend on developing software
How much does a software company spend on developing its software?
The plot below shows revenue vs software development costs for 100 US companies, in industry categories Computer programming services and Packaged software, with revenues greater than $100 million during 2014-2015. The data is from company accounts filed with the government (code+data, plus the Georgia Tech financial analysis lab where I found the data).
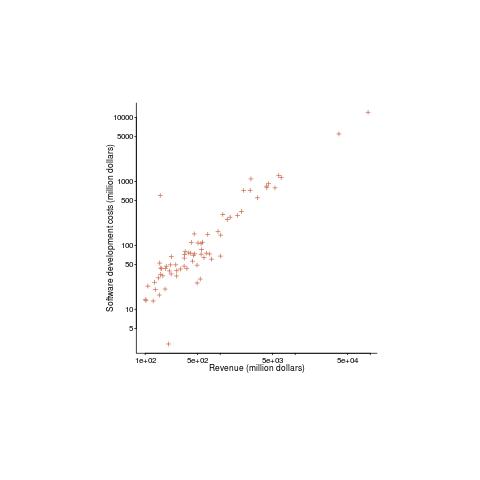
A straight line fits very well (a quadratic is slightly better, but let’s keep things simple) and shows companies spending 13% of their revenue on software development. A log-log graph suggests a power law, but in this case the fitted exponent is one, i.e., no power law as such.
If 13% is the figure for companies that would be expected to be spending heavily to develop software, how much do companies in other industry sectors pay? Google and Facebook are media companies (their income is from advertising), do they really spend that much on software?
There are an estimated 3.3 million software developers in the US. What is the average cost of a software developer? If we take an average salary of $80K, and do the usual doubling to factor in overheads, we get $160K. This gives a total software development cost (most of the cost is for people) in the US of around $0.5 trillion per year.
The above plot shows 1.6%0.6%6% of the estimated $0.5 trillion yearly software development costs in the US. Who is spending the other 98.4%99.4%94%? One place to look is the Form 10-K that public companies are required to submit to the Securities and Exchange Commission.
Facebook’s 10-K, for 2015, shows $4,816 million spent on R&D (is this all software?) and $3,633 million on “Computer software, office equipment and other” (I’m guessing almost none of this is capitalized software). Dividing R&D expenditure by number of employees (12,691 at the end of 2015) gives $380K. I know average Silicon valley salaries are high, but not that high. I have enough trouble following my own company’s accounts, so trying to understand Facebook’s is a lost cause before it starts.
Scraping the Form 10-K’s on the SEC site will not provide sensible numbers, they will have to be read and analyzed. There is enough material for several MBA projects…
US DoD software development data now available
I found a huge resource of software development data last weekend at the Defense Cost and Resource Center (DCARC). The Software Resource Data Report part of this resource contains information on around 2,000 major software development projects (any US DOD project over $20 million+) giving details of schedule, developer experience, money spent per year, lines of code, amount of code change, hours spent on at various stages of development and a whole lot more.
The catch? The raw data is only available to DoD analysts 🙁 I was a bit surprised that laws got passed mandating the collection of this kind of information and a lot less surprised that the DoD don’t want to make detailed development information for missile systems, radar installations, etc available to some interested parties; those of us who are not going to go out and build such systems are collateral damage.
What is the US government’s reason for requiring the collection and dissemination of this information? They want to reduce the huge amount of money currently being spent on the software development component of military systems (often a very large slice of the total project costs). Will having this data available reduce costs? It will certainly get project managers a lot more worried about project cost/time overruns if they know that lots of people outside the project are going to see their ‘failure’.
Hopefully there are Open data activists in the US who will push for a redacted form of the software data being made available to all interested parties, rather like that provided by the USA Spending site. In the meantime there are a few lucky DoD analysts who have gone from famine to feast and are probably having trouble figuring out where to start.
Update
The military like to rename things, and move stuff around. We now have: Cost Assessment Data Enterprise, with its software data.
Recent Comments