Archive
Distribution of integer literals in text/speech and source code
Numeric values are an integral to communication between people. What is the distribution of integer values in text/speech, and does the use of integer literals in source code have a similar distribution?
- The paper Numbers in Context: Cardinals, Ordinals, and Nominals in American English by Greg Woodin, and Bodo Winter studied the 9+ million numbers contained in the Corpus of Contemporary American English (7,744,038 integer values). The plot below shows the number of occurrences of the smaller integer values, and a fitted regression line for values in the range 1..50 (code+data):

The frequency of integer values in this corpus is proportional to:
 .
. - The paper Frequency of occurrence of numbers in the World Wide Web by Dorogovtsev, Mendes, and Gama Oliveira found that the number of web pages containing a given integer value declines as the value increases, with the decline for non-round numbers being roughly proportional to
 (round numbers are much more frequent than adjacent values and bias fitted models), and including all values gives
  (for values up to
  ).
).
Programs are an implementation of a sliver of the world in which people live, and it is to be expected that the frequency of numeric literal values in source code is highly correlated with real world frequency. Numeric values also appear in the algorithms and mathematical expressions used to create implementations. I am not aware of any studies looking at the frequency of use of numeric constants in algorithms and mathematics. As an aside, the frequency of occurrence of mathematical expressions containing a given number of operators is similar to that in C source
What are the usage characteristics of integer literals in source code (floating-point literal use is very rare outside of particular application domains)?
The plot below shows occurrences of decimal (green) and hexadecimal (blue) literals in C source (data from fig 825.1 from my C book) with a regression line fitted to values 1..50 of the decimal data (code+data):

The frequency of decimal literal values in C source is proportional to: . Adding the hexadecimal values to the model has little effect.
The paper What do developers consider magic literals? A smalltalk perspective by Anquetil, Delplanque, Ducasse, Zaitsev, Fuhrman, and Guéhéneuc studied the use of literals in Smalltalk. The plot below shows the number of occurrences of all kinds of integer literals and a fitted regression line (code+data):

The frequency of integer literal values in Smalltalk source is proportional to:  .
.
The distribution of integer literals in both human communication and source code is well-fitted by a power law. Smalltalk appears to be the outlier, with an exponent of 1.7 vs 1.3-1.4. Perhaps it’s a sample size issue; 14,054 integer literals for Smalltalk and a million+ for the other datasets.
I had expected source code to contain a lot more zeroes/ones, relative to other values, than human communication. Zero/one are such common values that there are implicit short-cuts that people can use to express them; removing the effort/cost needed to explicitly specify them. Some programming languages specify default 0/1 values for common idioms, but C-like languages generally require explicit specification of values.
Maximum team size before progress begins to stall
On multi-person projects people have to talk to each other, which reduces the amount of time available for directly working on writing software. How many people can be added to a project before the extra communications overhead is such that the total amount of code, per unit time, produced by the team decreases?
A rarely cited paper by Robert Tausworthe provides a simple, but effective analysis.
The plot below shows team productivity rate for a given number of team sizes, based on the examples discussed below.
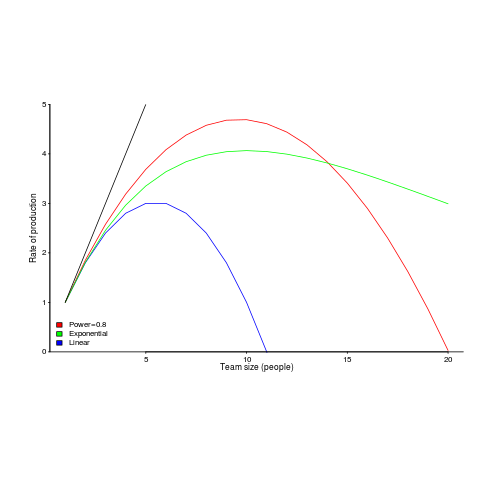
Activities are split between communicating and producing code.
If we assume the communications overhead is give by: ") , where
, where  is the percentage of one person’s time spent communicating in a two-person team,
  the number of developers and
  a constant greater than zero (I’m using Tausworthe’s notation).
The maximum team size, before adding people reduces total output, is given by: t_0})^{1/{alpha}}") .
.
If  (i.e., everybody on the project has the same communications overhead), then
  , which for small is approximately
  . For example, if everybody on a team spends 10% of their time communicating with every other team member:
  .
.
In this team of five, 50% of each persons time will be spent communicating.
If  , then we have
 *0.1})^{1/0.8}approx 10") .
.
What if the percentage of time a person spends communicating with other team members has an exponential distribution? That is, they spend most of their time communicating with a few people and very little with the rest; the (normalised) communications overhead is: t_1}") , where
, where  is a constant found by fitting data from the two-person team (before any more people are added to the team).
The maximum team size is now given by:  , and if
  , then:
  .
.
In this team of ten, 63% of each persons time will be spent communicating (team size can be bigger, but each member will spend more time communicating compared to the linear overhead case).
Having done this analysis, what is now needed is some data on the distribution of individual communications overhead. Is the distribution linear, square-root, exponential? I am not aware of any such data (there is a chance I have encountered something close and not appreciated its importance).
I have only every worked on relatively small teams, and am inclined towards the distribution of time spent communicating not being constant. Was it exponential or a power-law? I would not like to say.
Could a communications time distribution be reverse engineered from email logs? The cc’ing of people who might have an interest in a topic complicates the data analysis; time spent in meetings are another complication.
Pointers to data most welcome and as is any alternative analysis using data likely to have a higher signal/noise ratio.
Recent Comments