Archive
Distribution of binary operator results
As numeric values percolate through a program they appear as the operands of arithmetic operators whose results are new values. What is the distribution of binary operator result values, for a given distribution of operand values?
If we start with independent random values drawn from a uniform distribution,  , then:
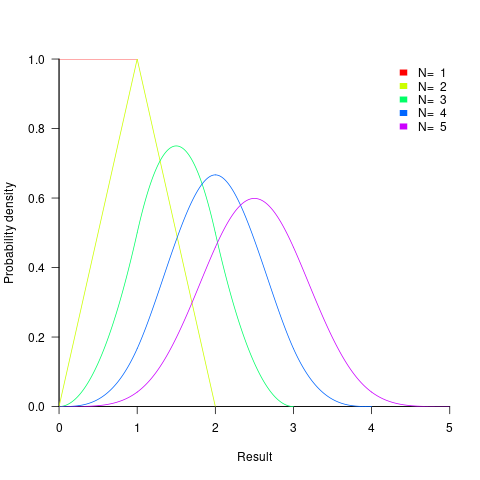
- the distribution of the result of adding two such values has a triangle distribution, and the result distribution from adding
 such values is known as the Irwin-Hall distribution (a polynomial whose highest power is
  ). The following plot shows the probability density of the result of adding 1, 2, 3, 4, and 5 such values (code+data):

- the distribution of the result of multiplying two such values has a logarithmic distribution, and when multiplying
 such values the probability of the result being
  is:
is:  .
.
If the operand values have a lognormal distribution, then the result also has a lognormal distribution. It is sometimes possible to find a closed form expression for operand values having other distributions.
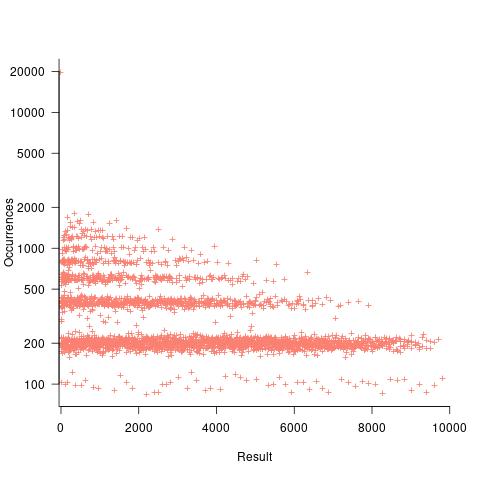
If both operands take integer values, including zero, some result values are more likely to occur than others; for instance, there are six unique factor pairs of positive integers that when multiplied return sixty, and of course prime numbers only have one factor-pair. The following plot was created by randomly generating one million pairs of values between 0 and 100 from a uniform distribution, multiplying each pair, and counting the occurrences of each result value (code+data):

- the probability of the result of dividing two such values being
 is: 0.5 when
  , and
, and  when
when  .
.
The ratio of two distributions is known as a ratio distribution. Given the prevalence of Normal distributions, their ratio distribution is of particular interest, it is a Cauchy distribution:
 ,
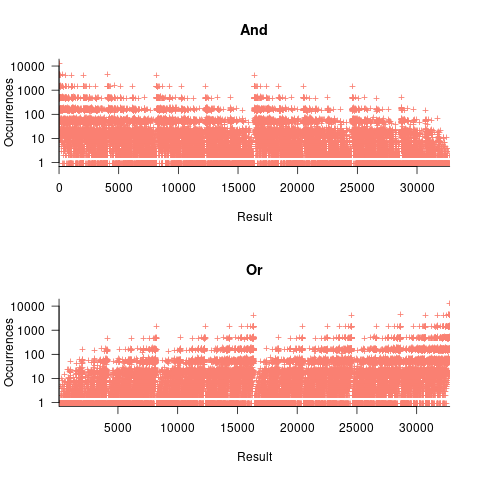
, - the result distribution of the bitwise and/or operators is not continuous. The following plots were created by randomly generating one million pairs of values between 0 and 32,767 from a uniform distribution, performing a bitwise AND or OR, and counting the occurrences of each value (code+data):

- the result distribution of the bitwise exclusive-or operator is uniform, when the distribution of its two operands is uniform.
The mean value of the Irwin-Hall distribution is  and its standard deviation is
  . As
. As  , the Irwin-Hall distribution converges to the Normal distribution; the difference between the distributions is approximately:
  .
.
The sum of two or more independent random variables is the convolution of their individual distributions,
The banding around intervals of 100 is the result of values having multiple factor pairs. The approximately 20,000 zero results are from two sets of  multiplications where one operand is zero,
The vertical comb structure is driven by power-of-two bits being set/or not. For bitwise-and the analysis is based on the probability of corresponding bits in both operands being set, e.g., there is a 50% chance of any bit being set when randomly selecting a numeric value, and for bitwise-and there is a 25% chance that both operands will have corresponding bits set; numeric values with a single-bit set are the most likely, with two bits set the next most likely, and so on. For bitwise-or the analysis is based on corresponding operand bits not being set,
The general pattern is that sequences of addition produce a centralizing value, sequences of multiplies a very skewed distribution, and bitwise operations combed patterns with power-of-two boundaries.
This analysis is of sequences of the same operator, which have known closed-form solutions. In practice, sequences will involve different operators. Simulation is probably the most effective way of finding the result distributions.
How many operations is a value likely to appear as an operand? Apart from loop counters, I suspect very few. However, I am not aware of any data that tracked this information (Daikon is one tool that might be used to obtain this information), and then there is the perennial problem of knowing the input distribution.
Programming language similarity based on their traits
A programming language is sometimes described as being similar to another, more wide known, language.
How might language similarity be measured?
Biologists ask a very similar question, and research goes back several hundred years; phenetics (also known as taximetrics) attempts to classify organisms based on overall similarity of observable traits.
One answer to this question is based on distance matrices.
The process starts by flagging the presence/absence of each observed trait. Taking language keywords (or reserved words) as an example, we have (for a subset of C, Fortran, and OCaml):
if then function for do dimension object C 1 1 0 1 1 0 0 Fortran 1 0 1 0 1 1 0 OCaml 1 1 1 1 1 0 1 |
The distance between these languages is calculated by treating this keyword presence/absence information as an n-dimensional space, with each language occupying a point in this space. The following shows the Euclidean distance between pairs of languages (using the full dataset; code+data):
C Fortran OCaml C 0 7.615773 8.717798 Fortran 7.615773 0 8.831761 OCaml 8.717798 8.831761 0 |
Algorithms are available to map these distance pairs into tree form; for biological organisms this is known as a phylogenetic tree. The plot below shows such a tree derived from the keywords supported by 21 languages (numbers explained below, code+data):

How confident should we be that this distance-based technique produced a robust result? For instance, would a small change to the set of keywords used by a particular language cause it to appear in a different branch of the tree?
The impact of small changes on the generated tree can be estimated using a bootstrap technique. The particular small-change algorithm used to estimate confidence levels for phylogenetic trees is not applicable for language keywords; genetic sequences contain multiple instances of four DNA bases, and can be sampled with replacement, while language keywords are a set of distinct items (i.e., cannot be sampled with replacement).
The bootstrap technique I used was: for each of the 21 languages in the data, was: add keywords to one language (the number added was 5% of the number of its existing keywords, randomly chosen from the set of all language keywords), calculate the distance matrix and build the corresponding tree, repeat 100 times. The 2,100 generated trees were then compared against the original tree, counting how many times each branch remained the same.
The numbers in the above plot show the percentage of generated trees where the same branching decision was made using the perturbed keyword data. The branching decisions all look very solid.
Can this keyword approach to language comparison be applied to all languages?
I think that most languages have some form of keywords. A few languages don’t use keywords (or reserved words), and there are some edge cases. Lisp doesn’t have any reserved words (they are functions), nor technically does Pl/1 in that the names of ‘word tokens’ can be defined as variables, and CHILL implementors have to choose between using Cobol or PL/1 syntax (giving CHILL two possible distinct sets of keywords).
To what extent are a language’s keywords representative of the language, compared to other languages?
One way to try and answer this question is to apply the distance/tree approach using other language traits; do the resulting trees have the same form as the keyword tree? The plot below shows the tree derived from the characters used to represent binary operators (code+data):

A few of the branching decisions look as-if they are likely to change, if there are changes to the keywords used by some languages, e.g., OCaml and Haskell.
Binary operators don’t just have a character representation, they can also have a precedence and associativity (neither are needed in languages whose expressions are written using prefix or postfix notation).
The plot below shows the tree derived from combining binary operator and the corresponding precedence information (the distance pairs for the two characteristics, for each language, were added together, with precedence given a weight of 20%; see code for details).

No bootstrap percentages appear because I could not come up with a simple technique for handling a combination of traits.
Are binary operators more representative of a language than its keywords? Would a combined keyword/binary operator tree would be more representative, or would more traits need to be included?
Does reducing language comparison to a single number produce something useful?
Languages contain a complex collection of interrelated components, and it might be more useful to compare their similarity by discrete components, e.g., expressions, literals, types (and implicit conversions).
What is the purpose of comparing languages?
If it is for promotional purposes, then a measurement based approach is probably out of place.
If the comparison has a source code orientation, weighting items by source code occurrence might produce a more applicable tree.
Sometimes one language is used as a reference, against which others are compared, e.g., C-like. How ‘C-like’ are other languages? Taking keywords as our reference-point, comparing languages based on just the keywords they have in common with C, the plot below is the resulting tree:

I had expected less branching, i.e., more languages having the same distance from C.
New languages can be supported by adding a language file containing the appropriate trait information. There is a Github repo, prog-lang-traits, send me a pull request to add your language file.
It’s also possible to add support for more language traits.
Number of possible different one line programs
Writing one line programs is a popular activity in some programming languages (e.g., awk and Perl). How many different one line programs is it possible to write?
First we need to get some idea of the maximum number of characters that written on one line. Microsoft Windows XP or later has a maximum command line length of 8191 characters, while Windows 2000 and Windows NT 4.0 have a 2047 limit. POSIX requires that _POSIX2_LINE_MAX have a value of at least 2048.
In 2048 characters it is possible to assign values to and use at least once 100 different variables (e.g., a1=2;a2=2.3;....; print a1+a2*a3...). To get a lower bound lets consider the number of different expressions it is possible to write. How many functionally different expressions containing 100 binary operators are there?
If a language has, say, eight binary operators (e.g., +, -, *, /, %, &, |, ^), then it is possible to write  visually different expressions containing 100 binary operators. Some of these expressions will be mathematically equivalent (adopting the convention of leaving out the operands), e.g.,
 + * can also be written as * + (the appropriate operands will also have the be switched around).
If we just consider expressions created using the commutative operators (i.e., +, *, &, |, ^), then with these five operators it is possible to write 1170671511684728695563295535920396 mathematically different expressions containing 100 operators (assuming the common case that the five operators have different precedence levels, which means the different expressions have a one to one mapping to a rooted tree of height five); this  is a lot smaller than
  .
.
Had the approximately  computers/smart phones in the world generated expressions at the rate of
  per second since the start of the Universe,
  seconds ago, then the
  created so far would be almost half of the total possible.
Once we start including the non-commutative operators such a minus and divide the number of possible combinations really starts to climb and the calculation of the totals is real complicated. Since the Universe is not yet half way through the commutative operators I will leave working this total out for another day.
Update (later in the day)
To get some idea of the huge jump in number of functionally different expressions that occurs when operator ordering is significant, with just the three operators -, / and % is is possible to create  mathematically different expressions. This is a factor of
  greater than generated by the five operators considered above.
If we consider expressions containing just one instance of the five commutative operators then the number of expressions jumps by another two orders of magnitude to  . This count will continue to increase for a while as more commutative operators are added and then start to decline; I have not yet worked things through to find the maxima.
Update (April 2012).
Sequence A140606 in the On-Line Encyclopedia of Integer Sequences lists the number of inequivalent expressions involving n operands; whose first few values are: 1, 6, 68, 1170, 27142, 793002, 27914126, 1150212810, 54326011414, 2894532443154, 171800282010062, 11243812043430330, 804596872359480358, 62506696942427106498, 5239819196582605428254, 471480120474696200252970, 45328694990444455796547766, 4637556923393331549190920306
Relative spacing of operands affects perception of operator precedence
What I found most intriguing about Google Code Search (shutdown Nov 2011) was how quickly searches involving regular expressions returned matches. A few days ago Russ Cox, the implementor of Code Search not only explained how it worked but also released the source and some precompiled binaries. Google’s database of source code did not include the source of R, so I decided to install CodeSearch on my local machine and run some of my previous searches against the latest (v2.14.1) R source.
In 2007 I ran an experiment that showed developers made use of variable names when making binary operator precedence decisions. At about the same time two cognitive psychologists, David Landy and Robert Goldstone, were investigating the impact of spacing on operator precedence decisions (they found that readers showed a tendency to pair together the operands that were visibly closer to each other, e.g., a with b in a+b * c rather than b with c).
As somebody very interested in finding faults in code the psychologists research findings on spacing immediately suggested to me the possibility that ‘incorrectly’ spaced expressions were a sign of failure to write code that had the intended behavior. Feeding some rather complicated regular expressions into Google’s CodeSearch threw up a number of ‘incorrectly’ spaced expressions. However, this finding went no further than an interesting email exchange with Landy and Goldstone.
Time to find out whether there are any ‘incorrectly’ spaced expressions in the R source. cindex (the tool that builds the database used by csearch) took 3 seconds on a not very fast machine to process all of the R source (56M byte) and build the search database (10M byte; the Linux database is a factor of 5.5 smaller than the sources).
The search:
csearch "w(+|-)w +(*|/) +w" |
returned a few interesting matches:
... modules/internet/nanohttp.c: used += tv_save.tv_sec + 1e-6 * tv_save.tv_usec; modules/lapack/dlapack0.f: $ ( T*( ONE+SQRT( ONE+S / T ) ) ) ) modules/lapack/dlapack2.f: S = Z( 3 )*( Z( 2 ) / ( T*( ONE+SQRT( ONE+S / T ) ) ) ) modules/lapack/dlapack4.f: $ ( T*( ONE+SQRT( ONE+S / T ) ) ) ) |
There were around 15 matches of code like 1e-6 * var (because the pattern w is for alphanumeric sequences and that is not a superset of the syntax of floating-point literals).
The subexpression ONE+S / T is just the sort of thing I was looking for. The three instances all involved code that processed tridiagonal matrices in various special cases. Google search combined with my knowledge of numerical analysis was not up to the task of figuring out whether the intended usage was (ONE+S)/T or ONE+(S/T).
Searches based on various other combination of operator pairs failed to match anything that looked suspicious.
There was an order of magnitude performance difference for csearch vs. grep -R -e (real 0m0.167s vs. real 0m2.208s). A very worthwhile improvement when searching much larger code bases with more complicated patterns.
Recent Comments