One code path dominates method execution
A recurring claim is that most reported faults are the result of coding mistakes in a small percentage of a program’s source code, with the 80/20 ‘rule’ being cited for social confirmation. I think there is something to this claim, but that the percentages are not so extreme.
A previous post pointed out that reported faults are caused by users. The 80/20 observation can be explained by users only exercising a small percentage of a program’s functionality (a tiny amount of data supports this observation). Surprisingly, there are researchers who believe that a small percentage of the code has some set of characteristics which causes it to contain most of a program’s coding mistakes (this belief has the advantage that a lot of source code is easily accessible and can be analysed to produce papers).
To what extent does user input direct program execution towards a small’ish subset of the code available to be executed?
The recent paper: Monitoring the Execution of 14K Tests: Methods Tend to Have One Path That Is Significantly More Executed by Andre Hora counted the number of times each path through a method’s source code was executed, when the method was called, for the 5,405 methods in 25 Python programs. These programs were driven by their 14,177 tests, rather than user input. The paper is focused on testing, in particular developer that developers tend to focus on positive tests.
Test suites are supposed to exercise all of a program’s source, so it is to be expected that these measurements will show a wider dispersion of code coverage than might be expected of typical user input.
The measurements also include a count of the lines executed/not executed along each executed method path. No information is provided on the number of unexecuted paths.
Within a method, there is always going to one path through the code that is executed more often than any other path. What this study found is that the most common path is often executed many more times than the other paths. The plot below shows, for each method (each +), the percentage of all calls to a method where the most common path was executed, against the total number of executed paths for that method; red/blue lines are fitted power law/exponential regression models, and the grey line shows the case where percentage executed is the fraction for a given number of paths (code+data):
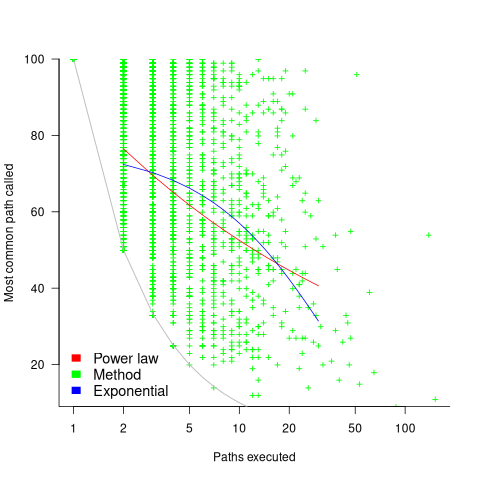
On average, the most common path is executed around four times more often than the second most commonly executed path.
While statistically significant, the fitted models do not explain much of the variance in the data. An argument can be made for either a power law and exponential distribution, and not having a feel for what to expect, I fitted both.
Non-error paths through a method have been found to be longer than the error paths. These measurements do not contain the information needed to attempt to replicate this finding.
New paths through a method are created by conditional statements, and the percentage of such statements in a method tends to be relatively constant across methods. The plot below shows the percentage of all calls to a method where the most common path was executed, where the method (each +) contains a given LOC; red/blue lines are fitted power law/exponential regression models (code+data):
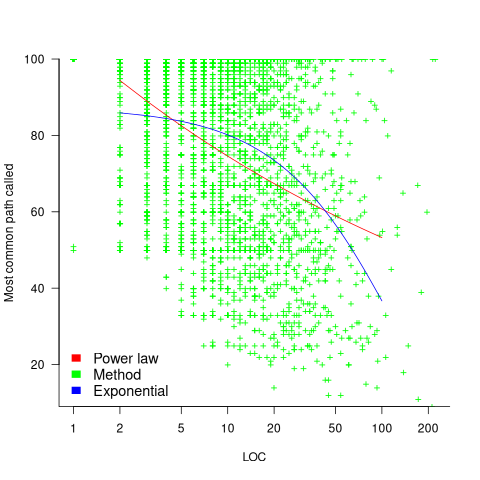
The models fitted to against LOC are better than those fitted against paths executed, but still not very good. A possible reason is that some methods will have unexecuted paths, LOC is a good proxy for total paths, and most common path percentage depends on total paths.
On average, 56% of a method’s LOC are executed along the most frequently executed path. When weighted by the number of method calls, the percentage is 48%.
The results of this study show that a call to most methods is likely to be dominated by the execution of one sequence of code. Another way that in which a small amount of code can dominate program execution is when most calls are to a small subset of the available methods. The plot below shows a density plot for the total number of calls to each method (code+data):

Around 62% of methods are called less than 100 times, while 2.6% are called over 10,000 times.
Recent Comments