Archive
The 2024 update to my desktop system
I have just upgraded my desktop system. As you can see from the picture below, it is a bespoke system; the third system built using the same chassis.
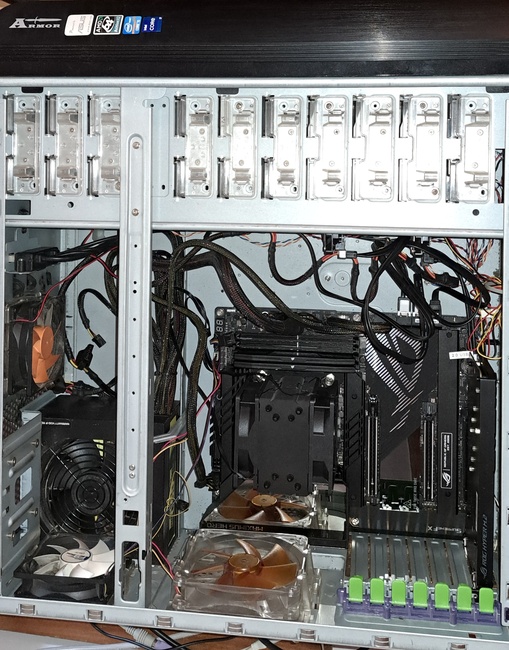
The 11 drive bays on the right are configured for six 5.25-inch and five 3.5-inch disks/CD/DVD/tape drives, there is a drive cage that fits above the power supply (top left) that holds another three 3.5-inch devices. The central black rectangle with two sets of four semicircular caps (fan above/below) is the cpu cooling tower, with two 32G memory sticks immediately to its right. The central left fan is reflected in a polished heatsink.
Why so many bays for disks?
The original need, in 2005 (well before GitHub), was for enough storage to hold the source code available, via ftp, from various hosting sites that were springing up, hence the choice of the Thermaltake Armour Series VA8000BWS Supertower. The first system I built contained six 400G Barracuda drives
The original power supply, a Thermaltake Silent Purepower 680W PSU, with its umpteen power connectors is still giving sterling service (black box with black fan at top left).
When building a system, I start by deciding on the motherboard. Boards supporting 6+ SATA connectors were once rare, but these days are more common on high-end systems. I also look for support for the latest cpu families and high memory bandwidth. I’m not a gamer, so no interest in graphics cards.
The three systems are:
- in 2005, an ASUS A8N-SLi Premium Socket 939 Motherboard, an AMD Athlon 64 X2 Dual-Core 4400 2.2Ghz cpu, and Corsair TWINX2048-3200C2 TwinX (2 x 1GB) memory. A Red Hat Linux distribution was installed,
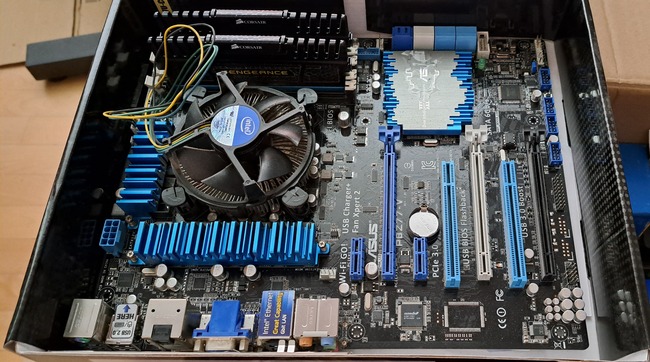
- in 2013, an intermittent problem appeared on the A8N motherboard, so I upgraded to an ASUS P8Z77-V 1155 Socket motherboard, an Intel Core i5 Ivy Bridge 3570K – 3.4 GHz cpu, and Corsair CMZ16GX3M2A1600C10 Vengeance 16GB (2x8GB) DDR3 1600 MHz memory. Terabyte 3.25-inch disk drives were now available, and I installed two 2T drives. A openSUSE Linux distribution was installed.
The picture below shows the P8Z77-V, with cpu+fan and memory installed, sitting in its original box. This board and the one pictured above are the same length/width, i.e., the ATX form factor. This board is a lot lighter, in color and weight, than the Z790 board because it is not covered by surprisingly thick black metal plates, intended to spread areas of heat concentration,
- in 2024, there is no immediate need for an update, but the 11-year-old P8Z77 is likely to become unreliable sooner rather than later, better to update at a time of my choosing. At £400 the ASUS ROG Maximus Z790 Hero LGA 1700 socket motherboard is a big step up from my previous choices, but I’m starting to get involved with larger datasets and running LLMs locally. The Intel Core i7-13700K was chosen because of its 16 cores (I went for a hefty cooler upHere CPU Air Cooler with two fans), along with Corsair Vengeance DDR5 RAM 64GB (2x32GB) 6400 memory. A 4T and 8T hard disk, plus a 2T SSD were added to the storage system. The Linux Mint distribution was installed.
The last 20-years has seen an evolution of the desktop computer I own: roughly a factor of 10 increase in cpu cores, memory and storage. Several revolutions occurred between the roughly 20 years from the first computer I owned (an 8-bit cpu running at 4 MHz with 64K of memory and two 360K floppy drives) and the first one of these desktop systems.
What might happen in the next 20-years?
Will it still be commercially viable for companies to sell motherboards? If enough people switch to using datacenters, rather than desktop systems, many companies will stop selling into the computer component market.
LLMs perform simple operations on huge amounts of data. The bottleneck is transferring the data from memory to the processors. A system where simple compute occurs within the memory system would be a revolution in mainstream computer architecture.
Motherboards include a socket to support a specialised AI chip, like the empty socket for Intel’s 8087 on the original PC motherboards, is a reuse of past practices.
A new NASA software dataset from the 1970s
When modeling the process of software development, to optimise the creation of new projects, the best measurement data to use are those relating to whatever developers are doing today.
Unfortunately, measurement data for software engineering processes is very hard to find; few development groups record anything about what they do, and even when they do the files are rarely kept.
Anybody involved in evidence-based software engineering has to be willing to work with whatever data is available, even when it is for software systems built decades ago.
The usefulness of any measurement data, ancient or recent, is dependent on its relevance to the questions being analysed.
During a recent search for the DACS dataset, I found measurement data for 29 software projects contained in a 1981 NASA report. While the projects happened decades ago (1975-1981) for a niche application (software for spacecraft), the measurement data is much more extensive than usual, containing background information on many of the projects; given the rarity of software project data from this period, the 47 rows of data on each project, in Table 3.1-1, looked interesting enough to extract and analyse (output from Amazon’s usually robust Textract needed some hours of manual post-processing; code+data).
While this data is not of immediate use, I will invariably get involved in a discussion, or analysis, where this dataset will be a big improvement on nothing.
Are there any points to note?
- there is a linear relationship between the totals of programmer hours and management hours, with an average of 4.4 programmer hours per management hour. This sounds low, but these projects are developing embedded software and there are likely to be many stakeholders,
- the average percentage of time spent in each phase of the Waterfall process used was: Design 31%, Code-Test 29%, System testing 11%, Acceptance testing 10%, Cleanup 20%. Lots of testing is to be expected for spacecraft software,
- the average number of project source lines was 34k. I don’t know whether this is high or low, NASA press releases invariably cite the total amount of code on the spacecraft.
It’s worth noting that this small dataset is of a size and project detail that was used by researchers in the 1970s/1980s to validate software theories that are still with us today, e.g., the COCOMO estimation model, the McCabe metrics were not validated on any data, and the Halstead metrics were checked using multiple datasets each of similar size. I suspect that many of these datasets also came from DOD or NASA projects.
Program fault reports are caused by its users
Faults are generated by users of the software; no users, no fault reports. Fault reports will be generated for software that is free of coding mistakes; one study found that 42.6% of fault reports were misclassified as either requests for an enhancement, changes to documentation, or a refactoring request, or not requiring changes to the code; a study of NASA spaceflight software found that 63% of reports in the defect tracking tool were change requests.
Is the number of reported faults proportional to the number of users, the log of the number of users, or perhaps it depends on the application, or who knows what?
Some users will only use some features, others other features. Some users will be occasional users, while some will be heavy users.
There are a handful of fault report datasets containing measurements of software usage. The largest, and most widely cited, is “Optimizing Preventive Service of Software Products” by E. N. Adams. The data is this paper lists the number of faults reported in eight time intervals (20 to 50,000 months), for nine applications running on IBM mainframes between 1975 and 1980. Traditionally, the licensing for many Mainframe applications charge customers a fee based on their usage. Does this usage data still exist? Perhaps there is some sitting on a shelf in court documents. Pointers to possible cases most welcome.
Early papers on software testing sometimes measured the amount of cpu, or elapsed time, between each fault experience. However, the raw data was rarely published.
Data is available, for the Debian and Ubuntu distributions, on the number of installs for each application (counts rely on local machine sending information on installs, which is now an opt-in process for Ubuntu).
The following analysis uses data from the paper Impact of Installation Counts on Perceived Quality: A Case Study on Debian by Herraiz, Shihab, Nguyen, and Hassan, and the Ubuntu popularity project.
The plot below shows the number of reported faults against number of installs for the 14,565 programs in the “wheezy” Debian release; red line is the fitted power law:  (code+data):
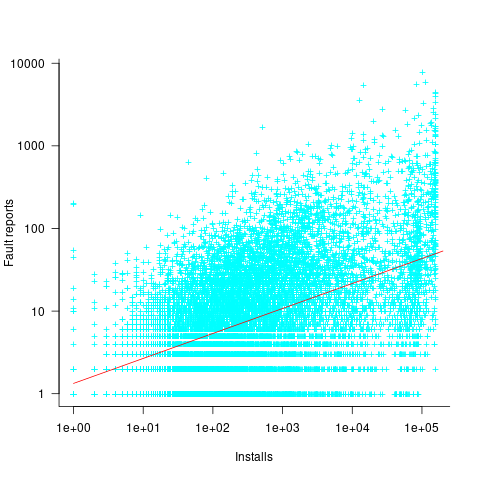
The huge variability in the number of fault reports for a given number of installs is likely driven by variability in the usage of the installed programs (or even no usage; I installed ImageMagick purely to use its convert program), the propensity of users of particular programs to report fault experiences (which in turn depends on the need for a fix, and the ease of reporting), and the number of coding faults in the source code.
The Debian installs/faults data does not include any usage information, however, the Ubuntu popularity data includes not only a count of installs, but the corresponding counts of regular users and non-usages. Given that Ubuntu is a fork of Debian, and has substantial usage, I’m assuming that the user base is sufficiently similar that the Ubuntu usage data at the time of the “wheezy” release can be applied to the “wheezy” Debian install/fault data.
The plot below shows, for 220,309 programs, the fraction of installs that are regularly used against the corresponding number of installs. The left-most line running top-left to bottom-right shows programs regularly used by one install, next line two regular users, etc (code+data):

Using the merged, by program name, Ubuntu usage/Debian fault counts, I built several regression models, along with plotting the data/fits. The quality of the models was worse than the original Debian model 🙁 . Two possibilities that spring to mind are: the correlation between usage and fault reports only becomes visible when the counts are divided into short periods (perhaps a year?), or the correlation is very weak. It is probably going to take a lot of time to work through this.
Confidence intervals: my one recommended practice
What recommended practices should developers/managers follow when analysing data they have collected/available?
The scientific approach to data analysis mandates specifying a hypothesis before gathering the data, let alone analysing it. This approach has proven workable when researchers are familiar with an evidence-based body of knowledge. In this environment it’s acceptable, even required, to criticise anyone who analyses data without having a hypothesis and just follow along where ever the data appears to lead.
In fields lacking an evidence-based body of knowledge, such as software engineering (which does have an extensive body of folklore), it can be difficult to articulate a reasonable set of hypothesis to test against, before analysing the date. Time and cost are the incentives that push developers/managers in to simply following the data where ever it leads them:
- understandably, they are only interested in solving their own local problem, not building global theories of software engineering practices,
- as occasional data analysts, developers/managers probably have little or no experience in formulating hypothesis, and don’t have the time to become familiar with the existing evidence around the processes of interest,
- formulating a hypothesis, along with its associated model of the world, can require a surprising amount of work, often involving many interacting factors to consider (an ad-hoc approach based on an evolving analysis of data can appear to need a lot less effort).
Following the data can feel like the agile approach to data analysis. However, thoughtlessly following the data is fraught with dangers, particularly with small sample sizes (while there are often copious quantities of source, the human side of software engineering often involves miniscule sample sizes). It has always been difficult to get developers to slow down and think when writing code, it seems unrealistic to expect habits to change for data analysis.
I take a somewhat schizophrenic approach in my workshop for software developers, with many slides illustrating the dangers of just jumping in, along with other slides showing how to quickly find patterns in data (the main topic of conversation during the hands-on sessions).
My one recommended practice is that confidence intervals be calculated and included in the presented results. Why just one recommendation? I think recommendations involving sample size, hypothesis, thinking hard, etc will be ignored. Results showing wide confidence intervals highlight a range of possible problems: insufficient sample sizes, along with marginal effects and other uncertainties.
The scientific recommendation approach would be to use p-values. The problem with these is that they will probably have to be explained to developers/managers, who will have little idea about how to interpret them.
The presence of confidence intervals in a summary of results is a major step up from current practices. My experiences with developer/manager driven data analysis include:
- using data, that happens to be available, that has no connection to the questions of interest,
- collecting data, but fail to extract much information (because primitive analysis techniques were used). This situation is also very common in software engineering research papers,
- selling an idea, not the results, sometimes blatantly going against the direction implied by the data analysis (not so common in research papers),
- getting lucky/unlucky with subject performance, in a tiny sample, and claim certainty in the results.
Recent Comments