Accuracy of Function Point estimates
The number of Function points, FP, contained in the implementation of a software system are counted by following a specified counting process. The number of FP counted for a project is mapped to a cost estimate by multiplying the number of FP by the predetermined cost value of one FP; the predetermined value is based on cost data from similar previous projects within the company. The FP process is so popular as a unit of cost estimation that there are six different ISO standards specifying six different Function point measurement processes.
TL;DR: Estimated cost is not as accurate as traditional time based estimating, although the estimation process may produce consistent FP counts.
The FP certification schemes run by various organizations require applicants to pass exams that check they are consistently following the specified processes to produce consistent FP counts, i.e., that certified practitioners give very similar answers for the same implementation problem. Experiments where subjects used different counting processes to count FP for the same task, have found what looks like a linear relationship between various pairs of FP counting processes.
Having certified FP employees/consultants produce similar counts is all well and good, but what management actually wants is a close correspondence between estimated and actual costs. What does the available data show with regard to FP cost estimation accuracy?
I know of two FP/Cost datasets, one containing 149 points from one company (actual costs have been normalised), and the other 492 points from three companies (actual costs in Euros; FP used is IFPUG); this dataset also includes additional context information and is used in this post’s analysis.
What is the relationship between an estimate based on FP and actual cost? The plot below show FP against actual cost, the red line is the fitted regression equation  , the grey line shows
  (code+data):
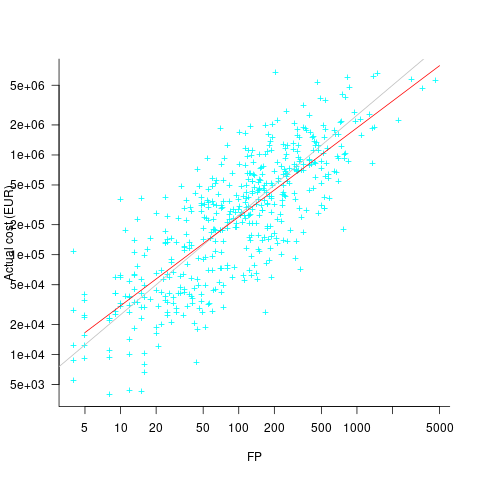
The power law exponent, 0.8, is slightly smaller than the 0.85 value found when fitting time estimates to actual times.
The dataset includes information specifying: anonymous organization ID, development method (78.5% plan driven and 21.5% Scrum), business domain (e.g., Call center, Mortgages, Front office), and various 0/1 flags each denoting a particular characteristic.
Including this information in a regression model finds that some of them have an impact on the FP to actual cost mapping. This is not surprising, since the FP/cost mapping is intended to be based on similar previous projects. The fitted model has the form:

where:  ,
,  ,
,  , and
, and  are constants for the corresponding items from the fitted regression model.
The fitted value for the scrum the development method is  , and
, and  for plan based (i.e., waterfall), i.e., Agile FP are cheaper than Waterfall FP. The idea of using both FP and scrum had not crossed my mind. Estimating via FP requires a detailed breakdown of the work to be done, while scrum is a process that discovers the work to be done. Perhaps a scrum like methodology was used to implement the detailed breakdown used to count FPs. The apparent lower cost of scrum FPs could just be a result of discovering that some planned functionality was not required.
How accurate were the FP estimates?
It is not possible to answer this question between we don’t know the cost assigned to one FP; in the above plot, the grey lines shows  .
.
We can calculate an estimate accuracy relative to the fitted model (the red line above). The mapping from FP to cost can vary between organizations, and the following analysis is based on the data for each distinct organization. The plot below shows the points, and associated fitted regression line, for the three organizations (code+data):
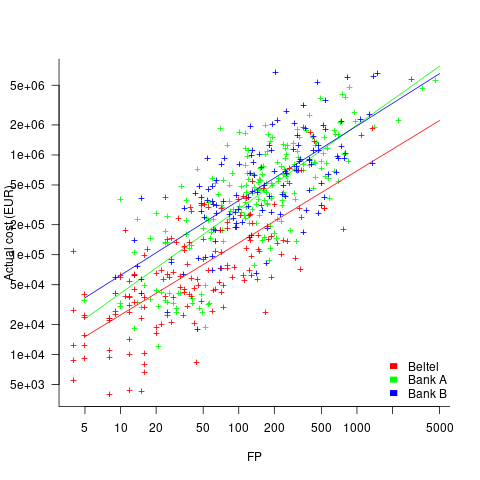
Each organization’s fitted regression model can be used to calculate confidence intervals. Approximately 68% of FP estimates could be off by over a factor two (between 2.3 and 2.5) from the mean actual cost, while for the 95% interval FP estimates could be off by over a factor five (it varied between 5.0 and 5.8); code+data. The corresponding factors for traditional developer time estimation are two and four.
The exponent varies between 0.72 and 0.84, with Beltel and Bank B having very similar values (the exponent for time estimates is often close to 0.85). The FP/Cost mapping is likely to be similar for the two banks, but lower for the telecoms company.
Does slicing the data by organization and business domain reduce the width of the confidence intervals, i.e., smaller multiplication factor? In some cases the width is reduced, but in other cases the width is increased; the 68% factor is between 1.9 and 3.1, the 95% factor is between 3.2 and 9.4.
Recent Comments