How large an impact does social conformity have on estimates?
People experience social pressure to conform to group norms. How big an impact might social pressure have on a developer’s estimate of the effort needed to implement some functionality?
If a manager suggests that the effort likely to be required is large/small, I would expect a developer to respond accordingly (even if the manager is thought to be incompetent; people like to keep their boss happy). Of course, customer opinions are also likely to have an impact, but what about fellow team members, or even the receptionist. Until somebody runs the experiments, we are going to have to do with non-software related tasks.
A study by Molleman, Kurversa, and van den Bos asked subjects (102 workers on Mechanical Turk) to estimate the number of animals in an image (which contained between 50 and 100 ants, flamingos, bees, cranes or crickets). Subjects were given 30 seconds to respond, and after typing their answer they were told that “another participant had estimated X“, and given 45 seconds to give a second estimate. The ‘social pressure’ estimate, X, was chosen to be around 15-25% larger/smaller than the estimate given (values from a previous experiment were randomly selected).
The plot below shows the number of second estimates where there was a given percentage change between the first and second estimates, red line is a loess fit; the formula used is  (code+data):
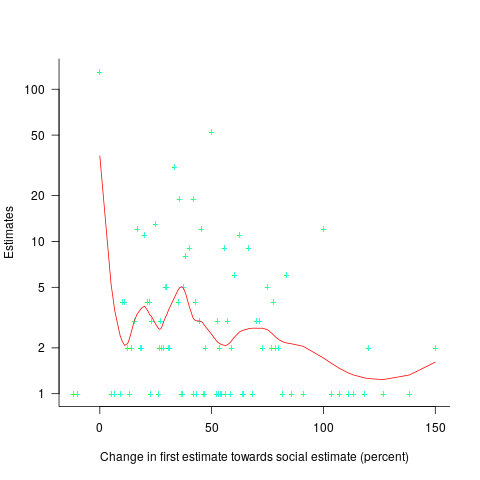
Around 25% of second estimates were unchanged, and 2% were changed to equal the social estimate. In two cases the second estimate was less than the first, and in eleven cases it was larger than the social estimate. Both the mean and median for shift towards the social estimate were just over 30% of the difference between the first estimate and the social estimate.
As with previous estimating studies, a few round numbers were often chosen. I was interested in finding out what impact the use of a round number value for the first estimate, or the social estimate, might have on the change in estimated value. The best regression model I could find showed that if the first estimate was exactly divisible by 5 (or 10), then the second estimate was likely to be around 5% larger. In fact divisible-by-5 was the only variable that had any predictive power.
My initial hypothesis was that the act of choosing a round number is an expression of uncertainty, and that this uncertainty increases the impact of the social estimate (when making the second estimate). An analysis of later experiments suggested that this pattern was illusionary (see below).
Modelling estimate values, rather than their differences, the equation:  explains nearly all the variance present in the data.
Two weeks after the first experiment, all 102 subjects were asked to repeat the experiment (they each saw the same images, in the same order, and social estimates as in the first study); 69 subjects participated. Nine months after the first experiment, subjects were asked to repeat the experiment again; 47 subjects participated, again with each subject seeing the same images in the same order, and social estimates. Thirty-five subjects participated in all three experiments.
To what extent were subjects consistently influenced by the social estimate, across three identical sessions? The Pearson correlation coefficient between both the first/second experiment, and the first/third experiment, was around 0.6.
The impact of round numbers was completely different, i.e., no impact on the second, and a -7% impact on the third (i.e., a reduced change). So much for my initial hypothesis.
The exponents in the above equation did not change much for the data from the second and third reruns of the experiment.
The variability in the social estimates used in these experiments, involving image contents, differs from software estimates in that they were only 12-25% different from the first estimate. Software estimates often differ by significantly larger amounts (in fact, a 12% difference would probably be taken as agreement).
With some teams, people meet to thrash out a team estimate. Data is sometimes available on the final estimate, but data on the starting values is very hard to come by. Pointers to experiments where social estimates are significantly different (i.e., greater than 50%) from the ones given by subjects welcome.
Recent Comments