Archive
I made a mistake, please don’t shoot me
The major difference between commercial/academic written software is the handling of user mistakes, or to be more exact what is considered to be a user mistake. In the commercial world the emphasis is on keeping the customer happy, which translates into trying hard to gracefully handle any ‘mistake’ the user makes. Academic software is generally written to solve a research problem and is often very unforgiving of users failing to keep to the undocumented straight and narrow; given the context this unforgiving behavior is understandable, but sometimes such software is released to an unsuspecting world.
The R archive of contributed packages, CRAN, is a good example of the academic approach to writing software. I am an active user of many packages in this archive and its contributors have my heart-felt thanks. But on a regular basis I make a mistake when calling a function in one of these packages, get shot in the foot and am not best pleased.
What makes the situation worse is that my mistakes are often so trivial and easy to fix (by both me or the package authors). My most common ‘mistake’ is passing an argument whose type is not handled by the function, e.g., passing a data-frame to diag (why do I have to convert the argument using as.matrix, when diag could spot my mistake and do the conversion for me instead of returning some horrible mess).
Commercial software can also be unforgiving of user mistakes; in fact early versions of a lot of commercial software is just as unfriendly as academic software. The difference is that the commercial managers will make it their business to ensure that developers fix the code to make it user friendly. Competition ensures that those who don’t listen to their users go out of business.
Updating code to gracefully handle user mistakes is often a chore and many developers hate having to do it, managers are needed to prod developers into doing the work. The only purpose for more than half of the code in a commercial product may be to handle user mistakes and the percentage can approach 90%.
A lot of Open Source software has significant commercial backing, e.g., Linux, Apache, Firefox and gcc/llvm, which means it is somebody’s job to make sure customer complaints are addressed.
What the R development team needs is more commercial backing (it appears to have very little, but I may be wrong). Then somebody can be hired to go through the popular packages to make then mistake friendly, feed the changes back to the original author and generally educate package developers about bullet proofing their code.
Amount of end-user usage of code in Firefox
How much end-user usage does the code in Firefox receive over time?
Short answer: The available data is very sparse and lots of hand waving is needed to concoct something.
The longer answer is below as another draft section from my book Empirical software engineering with R. As always, comments and pointers to more data welcome. R code and data here.
Suggestions for alternative methods of calculation also welcome.
Amount of end-user usage of code in Firefox
Source code that is never executed will not have any faults reported against it while code that is very frequently executed is more likely to have a fault reported against it than less frequently executed code.
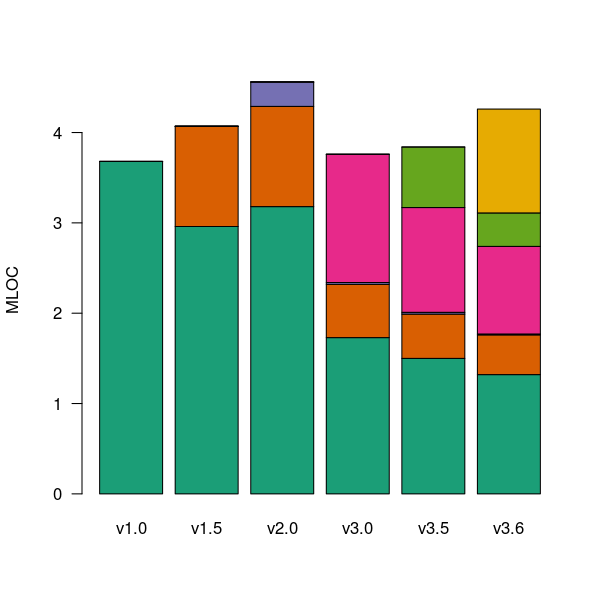
The Firefox browser has been the subject of several fault related studies. The study by Massacci, Neuhaus and Nguyen is of interest here because it provides the information needed to attempt to build a fault model that takes account of the total amount of usage that code experiences from all end-users of a program. The data used by the study applies to 899 Mozilla Firefox-related Security Advisories (MFSA, a particular kind of fault), noting the earliest and latest versions of Firefox that exhibits each fault; six major releases (i.e., versions 1.0, 1.5, 2.0, 3.0, 3.5 and 3.6) were analysed; the amount of code in each version that originated in earlier versions was measured (see plot below).
Massacci et al make their raw data available under an agreement that does not permit your author to directly distribute it to readers;; the raw data for the following analysis was reverse engineered from the Massacci et al paper; or obtained from other sources.
The following analysis is an attempt to build a model of amount of Firefox code usage, by end-users, over time, i.e., number of lines of Firefox source code being executed per unit time summed over all end-users at a given moment in time. The intent is to couple this model with fault data, looking for a relationship of the form: an X% change in usage results in a Y% change in reported faults.

Figure 1. Amount of source (millions of lines) in each version, broken down by the version in which it first appears. Data from Massacci, Neuhaus and Nguyen <book Massacci_11>.
As expected, a large amount of code from previous versions appears in later versions.
Since we are interested in the relationship between end-user code usage and faults (MFSAs in this case) we are only interested in versions of Firefox that are actively maintained by Mozilla. Every version has a first official release date and an end-of-support date beyond which no faults reported against it are fixed; any usage of a version after the end-of-support date is not of interest in this analysis.
How many people are using each version of Firefox at any time?
A number of websites list information on Firefox market share over time (as a percentage of all browsers measured), but only two known to your author break this information down by Firefox version. Massacci et al used url[netmarketshare.com] for Firefox version market share (data going back to November 2007), but your author found it easier to obtain information from url[www.w3schools.com] (data going back to May 2007). The W3schools data is obtained from the log of visitors to their site, which will obviously be subject to fluctuations (of unknown magnitude).
For the period November 2004 to April 2007 the market share of each Firefox version was estimated as follows:
- total Firefox market share was based on that listed by url[marketshare.hitslink.com]
- during the period when only version 1.0 was available, its market share was assumed to be the total Firefox market share,
- the market share for versions 1.5 and 2.0 was assumed to follow the trend of growth and decline seen in later releases for which data is available. Numbers were concocted that followed the version trend and summed to the known total market share.
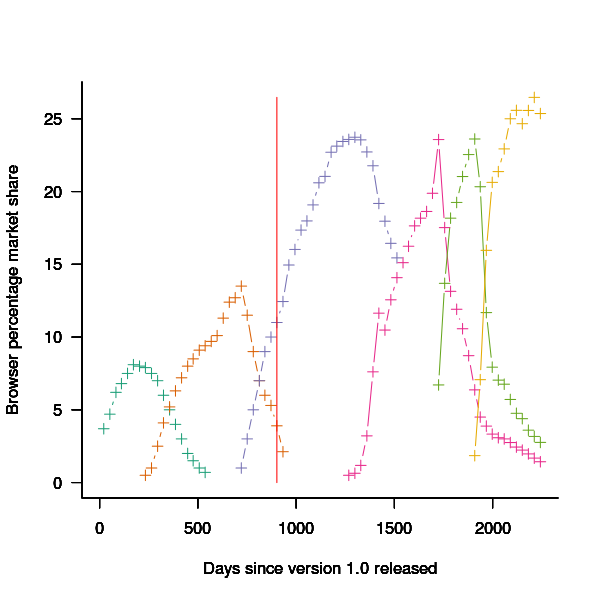
The plot below shows the market share of the six versions of Firefox between official release and end-of-support. Estimated values appear to the left of the vertical red line, values from measurements to the right. It can be seen that at its end-of-support date version 2.0 still had a significant market share.

Figure 2. Market share of Firefox versions between official release and end-of-support. Data from url[www.w3schools.com].
The International Telecommunications Union publishers an estimate of the number of people per 100 head of population with Internet access for each year between 2003 and 2011 <book ITU_12>; the data is broken down by developed/developing countries and also by major world regions. Assuming that everybody who users the Internet uses a browser, this information can be combined with market share and human population data to estimate the number of Firefox users.
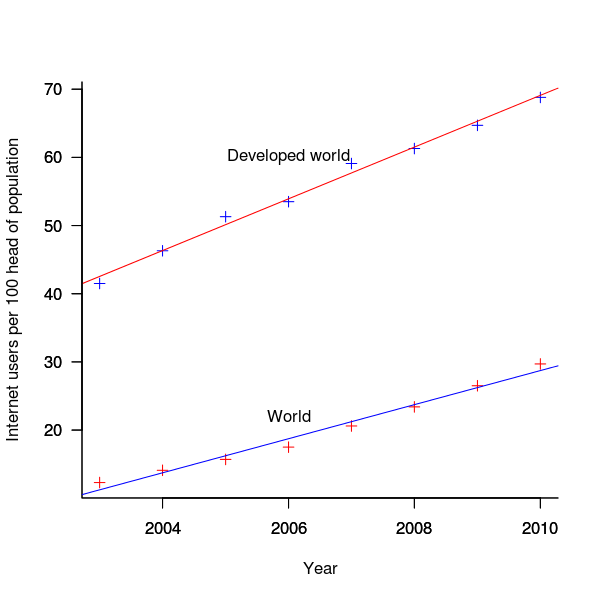
The ITU do not provide much information about how the usage figure is calculated or even which month of the year it applies to (since we are interested in change over time, knowing the month is not important and the start of the year is assumed). As the figure below shows the estimate over the period of interest can be accurately modeled by a straight line. A linear model was fitted to the data to predict usage between published estimates; over the period of interest the rate of growth in the Developed world has been almost twice as great as the rate in the whole world.

Figure 3. Number of people with Internet access per 100 head of population in the developed world and the whole world. Data from ITU <book <ITU_12>.
We are interested in relative change in total user population, and this can be obtained by multiplying the per-head of population value by the change in population (a 0.8% yearly growth is assumed for the developed world).
Possible significant factors for why the formula  might not accurately reflect the probability of a MFSA being reported include:
- the characteristics of people who started using the Internet in 2004 may be different from those who first started in 2010:
- there will be variation in the amount of time people spend browsing, does the distribution of time usage differ between early and late adopters?
- some people are more likely than others to report a fault (e.g., my mum is a late adopter and extremely unlikely to report a fault, whereas I might report a fault),
- there may be significant regional differences, e.g., European users vs. Chinese users. These differences include the Internet sites visited (the behavior of Firefox will depend on the content of the web page visited) and may affect their propensity to report a problem (e.g., do the cultural stereotypes of Chinese acceptance of authority mean they are unlikely to report a fault while those noisy Americans complain about everything?)
The end-user usage for code originally written for a particular version, at a point in time, is calculated as follows:
- number of lines of code originally written for a particular version that is contained within the code used to build a later version, or that particular version; call this the build version,
- times the market share of the build version,
- times the number of Internet users of the build version (users in the Developed world was used).
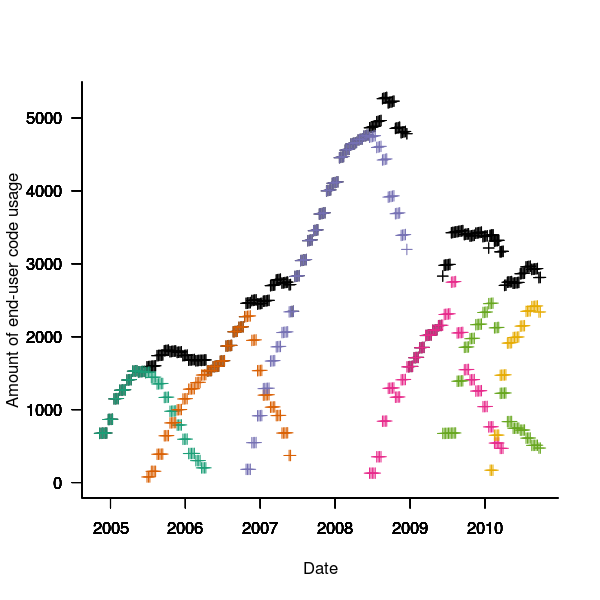
The plot below is an example using the source code originally written for Firefox version 1.0. The green points are the code usage for version 1.0 code executing in Firefox build version 1.0, the orange points the code usage for version 1.0 code executing in build version 1.5 and so on to the yellow points which is the code usage for version 1.0 code executing in build version 3.6. The black points are the sum over all build versions.

Figure 4. Amount of end-user usage of code originally written for Firefox version 1.0 by various other versions.
Much of the overall growth comes from growth in Internet usage, and in the early years there is also substantial growth in browser market share.
An analysis that attempts to connect Firefox usage with reported MFSAs will appear shortly (it would be surprising if fault report rate scaled linearly with end-user usage).
Unique bytes in a sliding window as a file content signature
I was at a workshop a few months ago where a speaker pointed out a useful technique for spotting whether a file contains compressed data, e.g., a virus hidden in a script by compressing it to look like a jumble of numbers. Compressed data contains a uniform distribution of byte values (after all, compression is achieved by reducing apparent information content), your mileage may vary between compression techniques. The thought struck me that it would only take a minute to knock up an R script to check out this claim (my use of R is starting to branch out into solving certain kinds of general coding problems) and here it is:
window_width=256  # if this is less than 256 divisor has to change in call to plot

plot_unique=function(filename)
{
t=readBin(filename, what="raw", n=1e7)

# Sliding the window over every point is too much overhead
cnt_points=seq(1, length(t)-window_width, 5)

u=sapply(cnt_points, function(X) length(unique(t[X:(X+window_width)])))
plot(u/256, type="l", xlab="Offset", ylab="Fraction Unique", las=1)

return(u)
}

dummy=plot_unique("http://shape-of-code.com/2013/05/17/preferential-attachment-applied-to-frequency-of-accessing-a-variable/")

dummy=plot_unique("http://www.shape-of-code.com/R_code/requirements.tgz") |
The unique bytes per window (256 bytes wide) of a HTML file has a mean around 15% (sd 2):

while for a tgz file the mean is 61% (sd 2.9):

I don’t have any scripts containing a virus, but I do have a pdf containing lots of figures (are viruses hidden in pieces all all together?):

Do let me know if you find any interesting ‘unique byte’ signatures for file contents.
Free range software developers: Are they cost effective?
I have just been reading an eye-opening article by Ramin Shokrizade about the techniques that online game designers use to extract money from players. Playing computer games and writing software have a great deal in common, two important characteristics they both share are being immersive and very enjoyable.
Reward Removal
From the article: “The technique involves giving the player some really huge reward, that makes them really happy, and then threatening to take it away if they do not spend.” Hmm, this sounds familiar. Beginner programmers are very resistant to deleting any code they have written, whereas more experienced developers are much less resistant to deleting code but they often put up a fight if an attempt is made to remove a feature they are responsible for creating.
“The longer you allow the player to have the reward before you take it away, the more powerful is the effect.” Wot! Remove this feature? What if somebody somewhere is using it?
“… uses the same technique at the end of each dungeon again in the form of an inventory cap. The player is given a number of “eggs” as rewards, the contents of which have to be held in inventory. If your small inventory space is exceeded, again those eggs are taken from you unless you spend to increase your inventory space.” Why are there no researchers with this kind of penetrating insight investigating how to make software engineering more cost effective? We continue to suffer from the programming is logic by other means world view, promulgated by the failed mathematicians that populate so many computing departments.
Premium Currencies
“To maximize the efficacy of a coercive monetization model, you must use a premium currency, …” [a premium currency is in-game money that is disconnected from real wold money]. The lesson here is that if you want software developers to make decisions relating to real world events you need to provide a direct and transparent connection to the real world. Hide the connection under layers of abstraction or vague metrics and developers can be easily fooled into making poor decisions.
Skill Games vs. Money Games
“A game of skill … ability to make sound decisions primarily determines … success. A money game … ability to spend money is the primary determinant of … success. Consumers far prefer skill games to money games, …. A key skill in deploying a coercive monetization model is to disguise your money game as a skill game.”
I think most developers consider their job to be one of making skillful decisions rather than one of making money for their employer, rationalizing that these skillful decisions result in their employer making money. Hmm, how much time do developers spend in skillful activity for what appear to outsiders as obscure coding issues; skillful activity is enjoyable while doing what makes most money for one’s employer can result in having to do lots of really dull and boring tasks. I cannot help but think that skill here is playing the role of a premium currency.
The big difference between playing a game and writing software is that in most cases a game has a well defined ending, a path exists to get there and players know when they get there. One of the reasons that managing software developers is like herding cats is that the ‘end’ is often very fuzzy and ill-defined. This does not mean that factory farming techniques are not applicable to software development, just that we have not yet figured out which techniques work.
Recent Comments