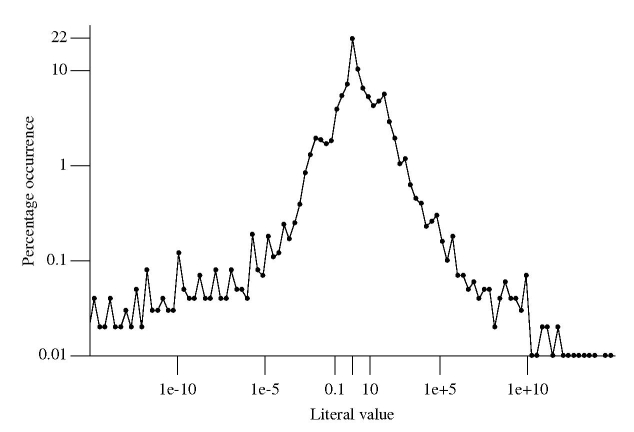
Frequency of floating literals in a given range
Last month I talked about one idea for estimating the ‘interestingness’ of a floating-point literal, counting the number of digits it contains. Another idea is to use the magnitude of the literal’s value; many values seem to cluster in the range -1 to +3 and perhaps a match against a value in this range ought to be filtered in some way.
Assume the two values 1.2 and 1200.0 are in the interesting number database. Both contain the same number of non-zero digits. More matches are likely to occur against the value 1.2, but this does not mean its false positive rate is higher compared to the value 1200 (that information can only come from knowledge of the application domain of the files whose contents are being matched).
Filtering based on the magnitude of a value might be used to reduce the total number of matches reported, e.g., only report the first match of a literal having a value within a certain range.
How often do floating-point literal values occur in source code? The following is based on 4.47 million non-zero floating-point literals (i.e., any literal having value 0.0 was not counted) in a wide variety of numeric source code:

The literal values were put into bins whose width were based on powers of 2. For instance, values between 0.25 and 0.5 went into bin -1, between 0.5 and 0 into bin 0, between 0 and 1 when into bin 1 and so on for smaller and larger numbers.
At 21.6% literals between 0.5 and 0.0 were the most common range, followed at 10.4% for literals between 0.0 and 1.0. The plot is slightly skewed towards having more values greater than 1.
Two discontinuities occur in the value frequencies between 0.001-0.02 and 16-64 (with the smaller values occupying a slightly larger range). This unexpected behavior has been added to my list of things to investigate at some point.
Recent Comments