Archive
Hardware variability may be greater than algorithmic improvement
I’m giving a talk at COW 39 this week and it is more user friendly to include links in this summary than link to a pdf of the slides (which actually looks horrible).
Microelectronic fabrication has now reached the point where it etches and deposits handfuls of atoms (around 20 or so). One consequence of working with such a small number of atoms is that variations in the fabrication process (e.g., plus or minus a few atoms here and there) can have a significant impact on component characteristics, e.g., a transistor consumes more/less power or can be switched faster/slower. It might be argued that things will average out over the few hundred+ million components inside a device and that all devices will be essentially the same; measurements show that in practice there is a lot of variation across the devices.
Short version: Some properties of supposedly identical microelectronic devices now vary by around 10% and this variability is likely to get larger in the future.
Nearly all published papers involving computer system power measurement are based on measuring a single system. Many of the claimed algorithmic improvements are less than 10%, i.e., less than the expected variation in power consumption across supposedly identical devices/systems. These days any empirical paper involving power consumption has to include measurements from many devices/systems if any credibility is to be given to the findings.
The following measurement data has been found while researching for a book (code and data used for talk); a beta version of the pdf will be available for download real soon now.
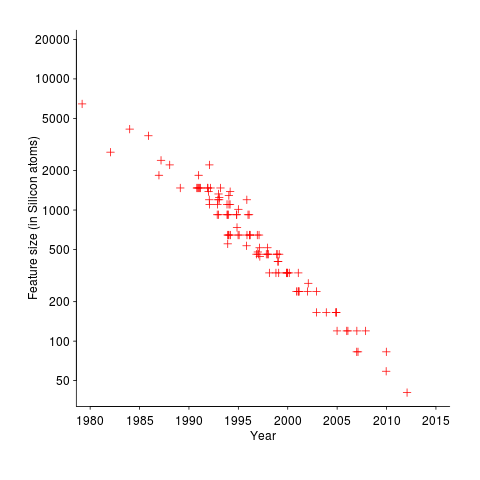
The following plot shows feature size, in Silicon atoms, of released microprocessors. Data from Danowitz et al.
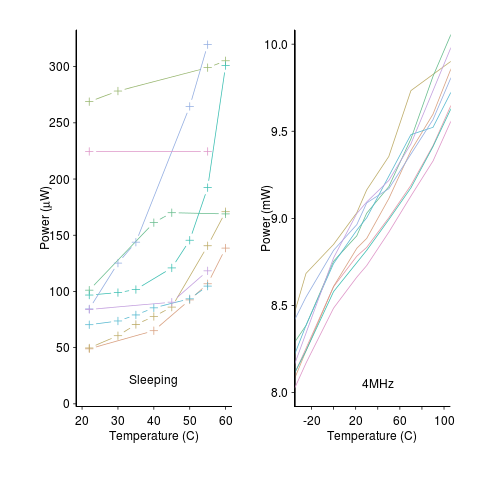
A study by Wanner, Apte, Balani, Gupta and Srivastava measured the power consumed by 10 separate Amtel SAM3U microcontrollers at various temperatures (embedded processors get used in a wide range of environments). The following plot shows how power consumption varied between processors at different temperatures when idling and executing. The relationship between the power characteristics of different processors changes with temperature; a large amount when idling and a little bit when executing.
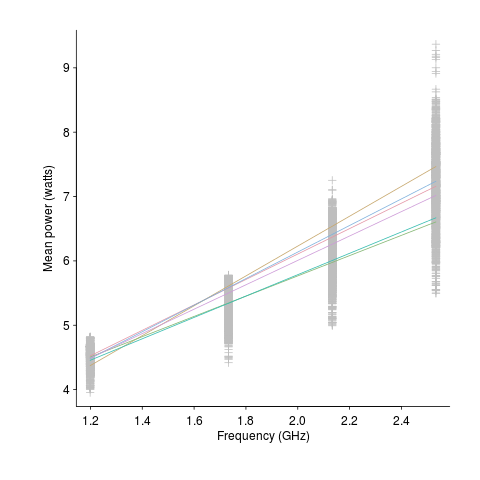
A study by Balaji, McCullough, Gupta and Agarwal measured the power consumption of six different Intel Core i5-540M processors, running at various frequencies, executing the SPEC2000 benchmark. The lines in the following plot were fitted to the data (grey crosses) using linear regression. The relationship between the power characteristics of different processors changes with clock frequency.
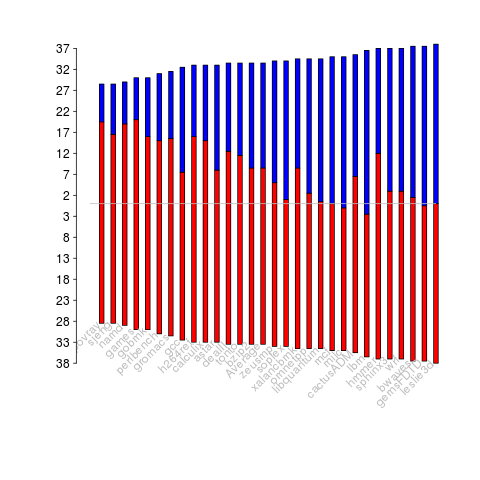
A study by Bircher measured power consumption of various system components, of an Intel server containing four Pentium 4 Xeons, when executing the SPEC CPU2006 benchmark. The power distribution for mobile devices would show the screen being the largest user of power, but I don’t have that data).
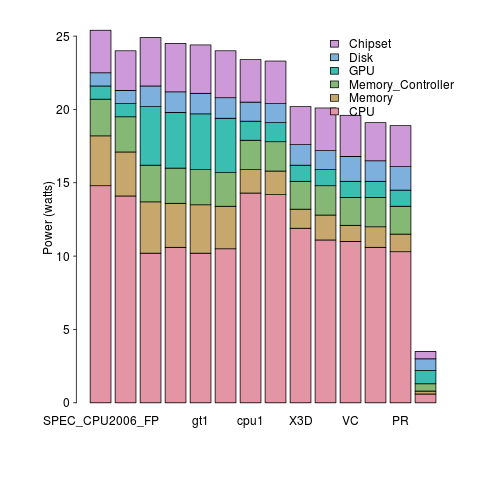
A study by Bircher measured memory (blue) and cpu (red) power consumption, in watts, executing the SPEC CPU2006 benchmarks. No point optimizig cpu power if over half the total power is consumed by memory.
A study by Krevat, Tucek and Ganger measured the performance of then modern disk drives originally sold in 2002 (left) and 2006 (right). Different colors showing through on the right indicates that some discs have different performance characteristics than the others (faster performance -> less time -> less power, i.e., I don’t have power data for disk differences)

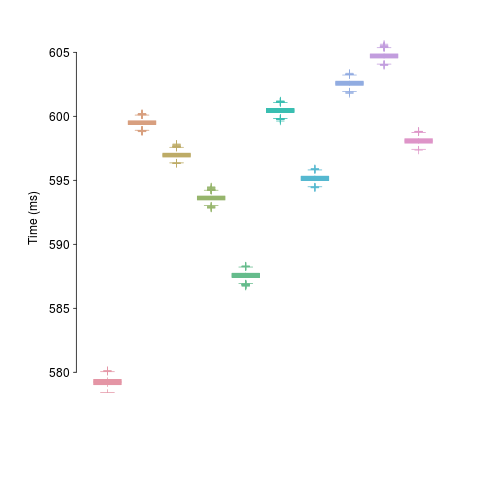
A study by Kalibera et al executed a benchmark 2,048 times followed by system reboot, repeated 10 times. Performance is consistent within a particular reboot, but not across them.
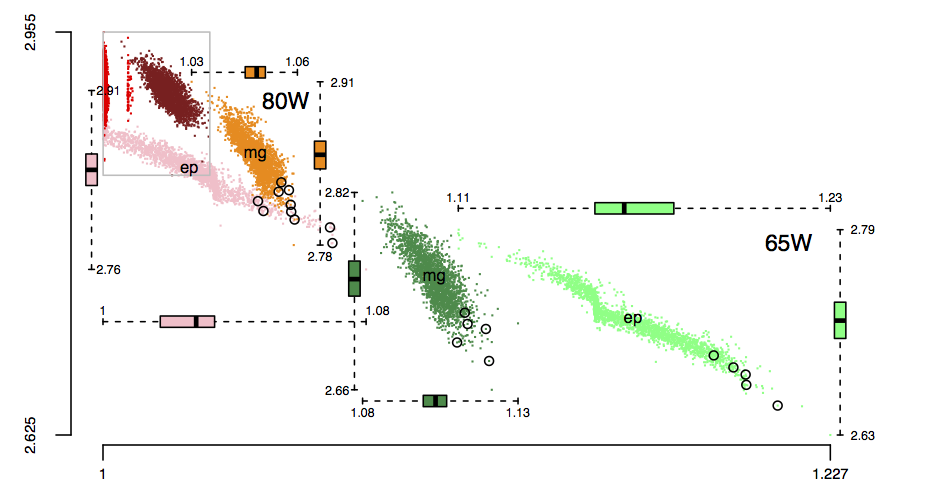
The following plot is in the slide deck and is included here as a teaser (i.e., more later). It shows data for 2,386 processors (x-axis is slowdown, y-axis clock frequency, top right legends max power), which thanks to Barry is now publicly available (or at least will be once some web details are sorted out).
Recent Comments