Archive
Deep dive looking for good enough reliability models
A previous post summarised the main highlights of my trawl through the software reliability research papers/reports/data, which failed to find any good enough models for estimating the reliability of a software system. This post summarises a deep dive into the technical aspects of the research papers.
I am now a lot more confident that better than worst case models for calculating software reliability don’t yet exist (perhaps the problem does not have a solution). By reliability, I mean the likelihood that a fault will be experienced during 1-hour of operation (1-hour is the time interval often used in safety critical standards).
All the papers assume that time to next new fault experience can be effectively modelled using timing information on the previously discovered distinct faults. Timing information might be cpu time, or elapsed time during testing or customer use, or even number of tests. Issues of code coverage and the correspondence between tests and customer usage are rarely mentioned.
Building a model requires making assumptions about the world. Given the data used, all the models assume that there is a relationship connecting the time between successive distinct faults, e,g, the Jelinski-Moranda model assumes that the time between fault experiences has an exponential distribution and that the exponent is the same for all faults. While the Jelinski-Moranda model does not match the behavior seen in the available datasets, it is widely discussed (its simplicity makes it a great example, with the analysis being straightforward and the result easy to explain).
Much of the fault timing data comes from the test process, with the rest coming from customer usage (either cpu or elapsed; like today’s cloud usage, mainframe time usage was often charged). What connection does a model fitted to data on the faults discovered during testing have with faults experienced by customers using the software? Managers want to minimise the cost of testing (one claimed use case for these models is estimating the likelihood of discovering a new fault during testing), and maximising the number of faults found probably has a higher priority than mimicking customer usage.
The early software reliability papers (i.e., the 1970s) invariably proposed a new model and then checked how well it fitted a small dataset.
While the top, must-read paper on software fault analysis was published in 1982, it has mostly remained unknown/ignored (it appeared as a NASA report written by non-academics who did not then promote their work). Perhaps if Nagel and Skrivan’s work had become widely known, today we might have a practical software reliability model.
Reliability research in the 1980s was dominated by theoretical analysis of the previously proposed models and their variants, finding connections between them and building more general models. Ramos’s 2009 PhD thesis contains a great overview of popular (academic) reliability models, their interconnections, and using them to calculate a number.
I did discover some good news. Researchers outside of software engineering have been studying a non-software problem whose characteristics have a direct mapping to software reliability. This non-software problem involves sampling from a population containing subpopulations of varying sizes (warning: heavy-duty maths), e.g., oil companies searching for new oil fields of unknown sizes. It looks, perhaps (the maths is very hard going), as-if the statisticians studying this problem have found some viable solutions. If I’m lucky, I will find a package implementing the technical details, or find a gentle introduction. Perhaps this thread will have a happy ending…
An aside: When quickly deciding whether a research paper is worth reading, if the title or abstract contains a word on my ignore list, the paper is ignored. One consequence of this recent detailed analysis is that the term NHPP has been added to my ignore list for software reliability issues (it has applicability for hardware).
Extracting information from duplicate fault reports
Duplicate fault reports (that is, reports whose cause is the same underlying coding mistake) are an underused source of information. I sometimes email the authors of a paper analysing fault data asking for information about duplicates. Duplicate information is rarely available, because the authors don’t bother to record it.
If a program’s coding mistakes are a closed population, i.e., no new ones are added or existing ones fixed, duplicate counts might be used to estimate the number of remaining mistakes.
However, coding mistakes in production software systems are invariably open populations, i.e., reported faults are fixed, and new functionality (containing new coding mistakes) is added.
A dataset made available by Sadat, Bener, and Miranskyy contains 18 years worth of information on duplicate fault reports in Apache, Eclipse and KDE. The following analysis uses the KDE data.
Fault reports are created by users, and changes in the rate of reports whose root cause is the same coding mistake provides information on changes in the number of active users, or changes in the functionality executed by the active users. The plot below shows, for 10 unique faults (different colors), the number of days between the first report and all subsequent reports of the same fault (plus character); note the log scale y-axis (code+data):

Changes in the rate at which duplicates are reported are visible as changes in the slope of each line formed by plus signs of the respective color. Possible reasons for the change include: the coding mistake appears in a new release which users do not widely install for some time, 2) a fault become sufficiently well known, or workaround provided, that the rate of reporting for that fault declines. Of course, only some fault experiences are ever reported.
Almost all books/papers on software reliability that model the occurrence of fault experiences treat them as-if they were a Non-Homogeneous Poisson Process (NHPP); in most cases, authors are simply repeating what they have read elsewhere.
Some important assumptions made by NHPP models do not apply to software faults. For instance, NHPP models assume that the probability of encountering a fault experience is the same for different coding mistakes, i.e., they are all equally likely. What does the evidence show about this assumption? If all coding mistakes had the same probability of producing a fault experience, the mean time between duplicate fault reports would be the same for all fault reports. The plot below shows the interval, in days, between consecutive duplicate fault reports, for the 392 faults whose number of duplicates was between 20 and 100, sorted by interval (out of a total of 30,377; code+data):
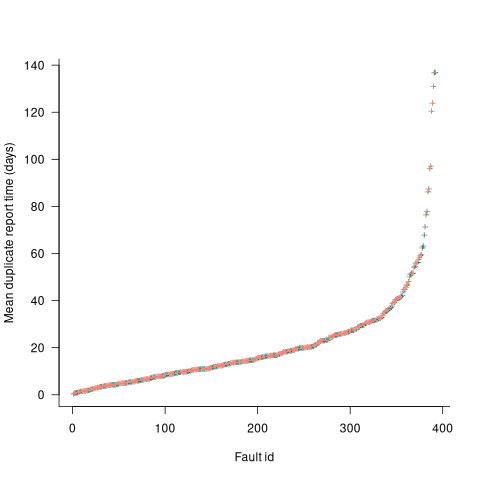
The variation in mean time between duplicate fault reports, for different faults, is evidence that different coding mistakes have different probabilities of producing a fault experience. This behavior is consistent with the observation that mistakes in deeply nested if-statements are less likely to be executed than mistakes contained in less-deeply nested code. However, this observation invalidating assumptions made by NHPP models has not prevented them dominating the research literature.
Recent Comments