Archive
Long term growth of programming language use
The names of files containing source code often include a suffix denoting the programming language used, e.g., .c for C source code. These suffixes provide a cheap and cheerful method for estimating programming language use within a file system directory.
This method has its flaws, with two main factors introducing uncertainty into the results:
- The suffix denoting something other than the designated programming language.
- Developer choice of suffix can change over time and across development environments, e.g., widely used Fortran suffixes include
.f,.for,.ftn, and .f77(Fortran77 was the second revision of the ANSI, and the version I used intensely for several years; ChatGPT only lists later versions, i.e.,f90,f95, etc).
The paper: 50 Years of Programming Language Evolution through the Software Heritage looking glass by A. Desmazières, R. Di Cosmo, and V. Lorentz uses filename suffixes to track the use of programming languages over time. The suffix data comes from the Software Heritage, which aims to collect, and share all publicly available source code, and it currently hosts over 20 billion unique source files.
The authors extract and count all filename suffixes from the Software Heritage archive, obtaining 2,836,119 unique suffixes. GitHub’s linguist catalogue of file extensions was used to identify programming languages. The top 10 most used programming languages, since 2000, are found and various quantities plotted.
A 1976 report found that at least 450 programming languages were in use at the US Department of Defense, and as of 2020 close to 9,000 languages are listed on hopl.info. The linguist catalogue contains information on 512 programming languages, with a strong bias towards languages to write open source. It is missing entries for Cobol and Ada, and its Fortran suffix list does not include .for, .ftn and .f77.
The following analysis takes an all encompassing approach. All suffixes containing at up to three characters, the first of which is alphabetic, and occurring at least 1,000 times in any year, are initially assumed to denote a programming language; the suffixes .html, .java and .json are special cased (4,050 suffixes). This initial list is filtered to remove known binary file formats, e.g., .zip and .jar. The common file extensions listed on FileInfo were filtered using the algorithm applied to the Software Heritage suffixes, producing 3,990 suffixes (the .ftn suffix, and a few others, were manually spotted and removed). Removing binary suffixes reduced the number of assumed language suffixes from 4,050 (15,658,087,071 files) to 2,242 (9,761,794,979 files).
This approach is overly generous, and includes suffixes that have not been used to denote programming language source code.
The plot below shows the number of assumed source code files created in each year (only 50% of files have a creation date), with a fitted regression line showing a 31% annual growth in files over 52 years (code+data):
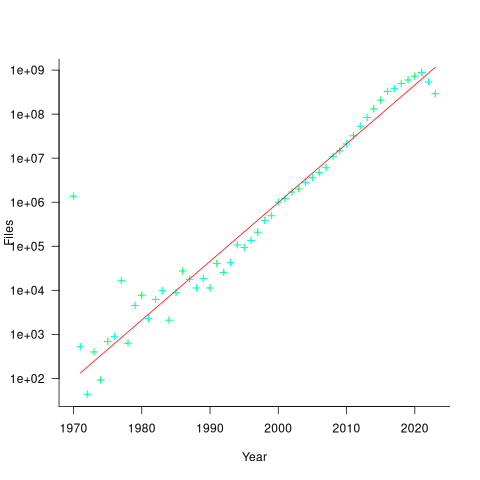
Some of the apparent growth is actually the result of older source being more likely to be lost.
Unix timestamps start on 1 Jan 1970. Most of the 1,411,277 files with a 1970 creation date probably acquired this date because of a broken conversion between version control systems.
The plot below shows the number of files assumed to contain source code in a given language per year, with some suffixes used before the language was invented (its starts in 1979, when total file counts stat always being over 1,000; code+data):
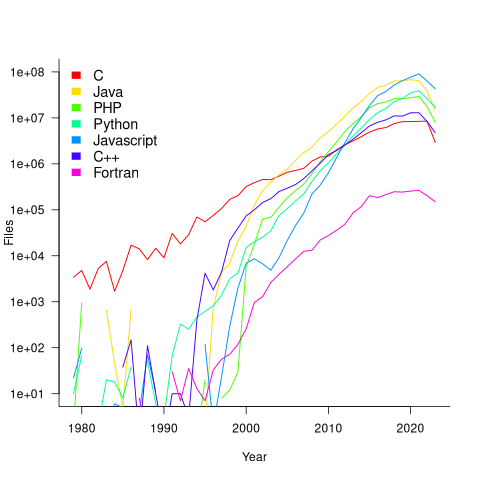
Over the last few years, survey results have been interpreted as showing declining use of C. This plot suggests that use of C is continuing to grow at around historical rates, but that use of other languages has grown rapidly to claim a greater percentage of developer implementation effort.
The major issue with this plot is what is not there. Where is the Cobol, once the most widely used language? Did Fortran only start to be used during the 1990s? Millions of lines of Cobol and Fortran were written between 1960 and 1985, but very little of this code is publicly available.
Modeling program LOC growth with recurrence equations
Models predicting the growth, in lines of code, of a program are based on the assumption that future growth follows the same pattern of behavior as past growth. One such model is the recurrence relation:
 , where:
  is LOC at time
  ,
,  is the LOC carried over from release
  , and
, and  is the LOC added after release .
The solution to this recurrence relation is: }/{1-a}+a^n*L_0") , where:
, where:  is the LOC at time
  .
.
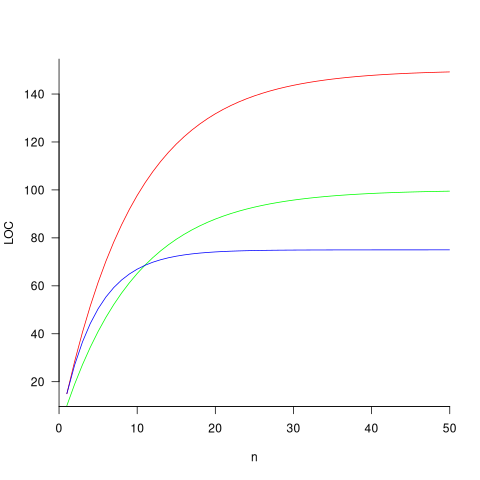
The plot below shows the growth predicted by this model, for various values of  and (code+data):
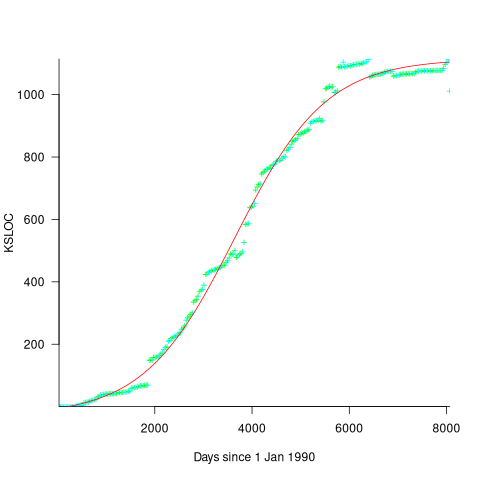
How close is the fit between this model and actual project growth? The plot below shows the growth in LOC for FreeBSD between 1993 and 2006, data from Herraiz; the red line shows the above equation fitted using non-linear regression, with the blue line showing a fitted linear regression model of the form  (code+data):
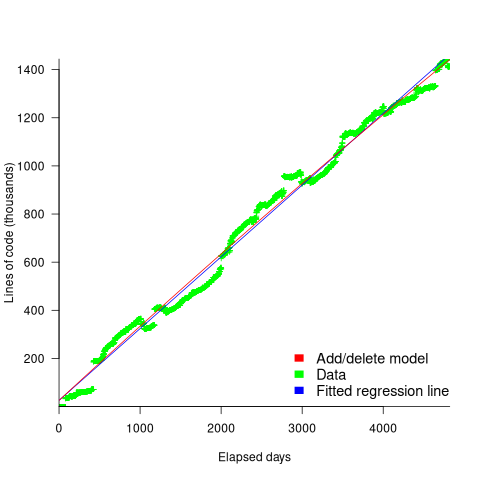
Plugging the fitted coefficients into the recurrence equation when  gives a prediction for the final maximum LOC in FreeBSD of:
}/{1-a} = 0.3124766/(1-0.9999750) = 12,477 KLOC")
The FreeBSD growth is unusual in not having a slow start to its growth, or rather no data is available prior to 1993.
Long-lived, successful projects usually attract new developers, and over time some developers leave. The size of a project, and the predispositions of those involved, can limit the number of active core developers. The above model can be applied to the growth in the number of active developers, i.e.,
 , where:
  is active developers at time ,
  is the developers ceasing to be active , and
  is the number of new active developers at . The solution is:
}/{1-c}+c^n*P_0")
Adding the developer growth equation in to the LOC model, we get:
 , where is now multiplied by the number of developers at time
  , i.e.,
  . The solution to these recurrence equations is somewhat involved (note: if you are using an LLM to check the answers, ChatGPT makes multiple mistakes, but the Grok response contains just one algebra mistake); when
  the equation is:
-d)/{c(1-c)}-b*d/{(1-c)(1-a)})*a^n+{b*(P_0*(1-c)-d)/{c(1-c)}}*c^{n-1}+b*d/{(1-c)(1-a)}")
Checking this more complicated model against another project, the plot below shows the growth of the GNU C library between 1990 and 2011, data from Gonzalez-Barahona, Robles, Herraiz and Ortega; the red line is the fitted equation /935}}") (code+data):
(code+data):
Unsurprisingly, I was not able to fit the more complicated growth model, using non-linear least squares, to the glibc LOC data. The problem was not being able to mimic the slow initial growth rate. I suspect that the developer growth model might be just wrong. Development work on a project does not last forever, and the number of developers will start decreasing at some point. For large projects, the Rayleigh distribution has been found to approximate staffing levels.
Data on project developer numbers over time is rare. The Linux kernel data shows an exponential developer growth rate, but I suspect that this is mostly caused by many one-time only developer contributing towards a new device driver (which are responsible for much of the Kernel growth).
Debian has cast iron rules for package growth & death
A plot in a paper on the growth of packages in Debian over the last 15 years caught my eye. The number of packages in growing approximately linear in time (fitted red line) while the total lines of code is each release (green line, axis on right in GigaSLOC) is growing non-linearly (I suspect exponential). The obvious conclusion is that the size of each package is also growing over time; rummaging through the data provided with the paper uncovered an increase in average package size from 25.6 to 39.4 KSLOC (the full dataset is being made available on the 15th of this month).
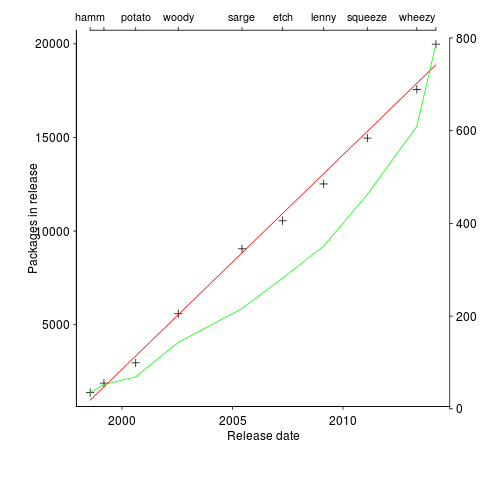
The straight line fit is excellent, explaining over 99.5% of the variance (code and data). Packages have been constantly added at the rate of 3.3 per day for over 15 years. Is there some rule that says Debian has to grow at 1,000 packages per year?
The numbers in one table showed that packages were being removed in non-trivial quantities. I wondered what the half-life of a package might be and in amongst the data provided by the paper’s authors was a list of packages shipped in each Debian release, just what was needed to create a survival curve. The answer to my package half-life question is around 11 years, as can be seen below (dashed lines are the 95% confidence interval).
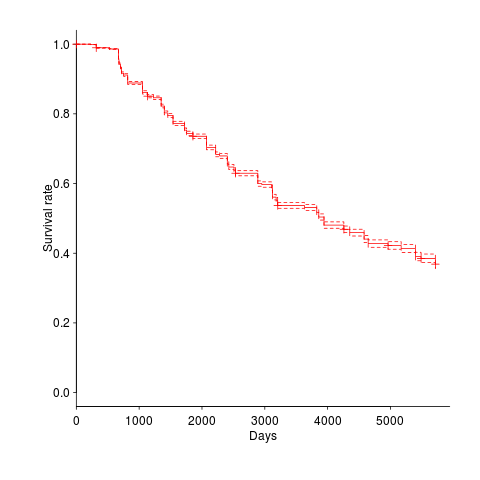
Most packages survive for two Debian releases, followed by a 10% cull and then steady decline; the survival curve is slightly concave, meaning younger packages are more likely to be removed (rather than removal being age independent). An 11 year half-life corresponds to an annual removal rate of around 9%. Is this another Debian release rule, around 10% of current packages must be removed for the next release (which means they have to be replaced by an equal number of new packages to keep that steady 3.3 per day overall increase)?
Where is all the code needed to increase the size of existing packages, and create all these new packages, coming from?
Perhaps packages are being replaced by a variant of themselves, created by somebody who has jumped in with lots of ideas (and free time) about where they want to take the application.
If there are 1,000 different kinds of application, then Debian now have 20 implementations of each of them and the next release will have one new implementation for each of them and almost two of each existing implementations will be replaced.
I wonder how much of this code is copy-and-paste, we will have to wait for the release of the full dataset (and some spare time on somebodies part).
Recent Comments