Archive
Modeling program LOC growth with recurrence equations
Models predicting the growth, in lines of code, of a program are based on the assumption that future growth follows the same pattern of behavior as past growth. One such model is the recurrence relation:
 , where:
  is LOC at time
  ,
,  is the LOC carried over from release
  , and
, and  is the LOC added after release .
The solution to this recurrence relation is: }/{1-a}+a^n*L_0") , where:
, where:  is the LOC at time
  .
.
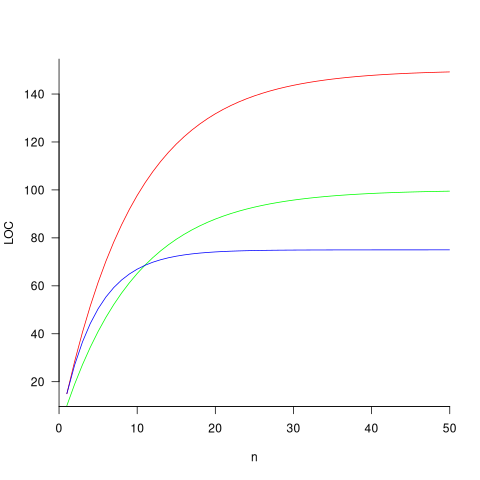
The plot below shows the growth predicted by this model, for various values of  and (code+data):
How close is the fit between this model and actual project growth? The plot below shows the growth in LOC for FreeBSD between 1993 and 2006, data from Herraiz; the red line shows the above equation fitted using non-linear regression, with the blue line showing a fitted linear regression model of the form  (code+data):
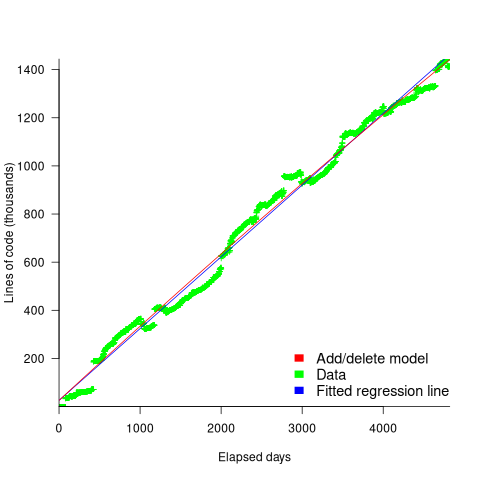
Plugging the fitted coefficients into the recurrence equation when  gives a prediction for the final maximum LOC in FreeBSD of:
}/{1-a} = 0.3124766/(1-0.9999750) = 12,477 KLOC")
The FreeBSD growth is unusual in not having a slow start to its growth, or rather no data is available prior to 1993.
Long-lived, successful projects usually attract new developers, and over time some developers leave. The size of a project, and the predispositions of those involved, can limit the number of active core developers. The above model can be applied to the growth in the number of active developers, i.e.,
 , where:
  is active developers at time ,
  is the developers ceasing to be active , and
  is the number of new active developers at . The solution is:
}/{1-c}+c^n*P_0")
Adding the developer growth equation in to the LOC model, we get:
 , where is now multiplied by the number of developers at time
  , i.e.,
  . The solution to these recurrence equations is somewhat involved (note: if you are using an LLM to check the answers, ChatGPT makes multiple mistakes, but the Grok response contains just one algebra mistake); when
  the equation is:
-d)/{c(1-c)}-b*d/{(1-c)(1-a)})*a^n+{b*(P_0*(1-c)-d)/{c(1-c)}}*c^{n-1}+b*d/{(1-c)(1-a)}")
Checking this more complicated model against another project, the plot below shows the growth of the GNU C library between 1990 and 2011, data from Gonzalez-Barahona, Robles, Herraiz and Ortega; the red line is the fitted equation /935}}") (code+data):
(code+data):
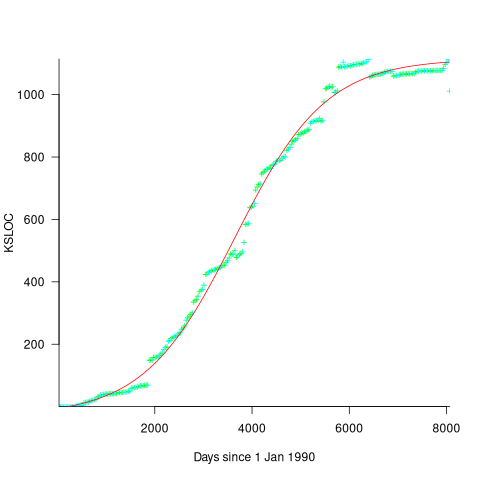
Unsurprisingly, I was not able to fit the more complicated growth model, using non-linear least squares, to the glibc LOC data. The problem was not being able to mimic the slow initial growth rate. I suspect that the developer growth model might be just wrong. Development work on a project does not last forever, and the number of developers will start decreasing at some point. For large projects, the Rayleigh distribution has been found to approximate staffing levels.
Data on project developer numbers over time is rare. The Linux kernel data shows an exponential developer growth rate, but I suspect that this is mostly caused by many one-time only developer contributing towards a new device driver (which are responsible for much of the Kernel growth).
Recent Comments