Archive
Program fault reports are caused by its users
Faults are generated by users of the software; no users, no fault reports. Fault reports will be generated for software that is free of coding mistakes; one study found that 42.6% of fault reports were misclassified as either requests for an enhancement, changes to documentation, or a refactoring request, or not requiring changes to the code; a study of NASA spaceflight software found that 63% of reports in the defect tracking tool were change requests.
Is the number of reported faults proportional to the number of users, the log of the number of users, or perhaps it depends on the application, or who knows what?
Some users will only use some features, others other features. Some users will be occasional users, while some will be heavy users.
There are a handful of fault report datasets containing measurements of software usage. The largest, and most widely cited, is “Optimizing Preventive Service of Software Products” by E. N. Adams. The data is this paper lists the number of faults reported in eight time intervals (20 to 50,000 months), for nine applications running on IBM mainframes between 1975 and 1980. Traditionally, the licensing for many Mainframe applications charge customers a fee based on their usage. Does this usage data still exist? Perhaps there is some sitting on a shelf in court documents. Pointers to possible cases most welcome.
Early papers on software testing sometimes measured the amount of cpu, or elapsed time, between each fault experience. However, the raw data was rarely published.
Data is available, for the Debian and Ubuntu distributions, on the number of installs for each application (counts rely on local machine sending information on installs, which is now an opt-in process for Ubuntu).
The following analysis uses data from the paper Impact of Installation Counts on Perceived Quality: A Case Study on Debian by Herraiz, Shihab, Nguyen, and Hassan, and the Ubuntu popularity project.
The plot below shows the number of reported faults against number of installs for the 14,565 programs in the “wheezy” Debian release; red line is the fitted power law:  (code+data):

The huge variability in the number of fault reports for a given number of installs is likely driven by variability in the usage of the installed programs (or even no usage; I installed ImageMagick purely to use its convert program), the propensity of users of particular programs to report fault experiences (which in turn depends on the need for a fix, and the ease of reporting), and the number of coding faults in the source code.
The Debian installs/faults data does not include any usage information, however, the Ubuntu popularity data includes not only a count of installs, but the corresponding counts of regular users and non-usages. Given that Ubuntu is a fork of Debian, and has substantial usage, I’m assuming that the user base is sufficiently similar that the Ubuntu usage data at the time of the “wheezy” release can be applied to the “wheezy” Debian install/fault data.
The plot below shows, for 220,309 programs, the fraction of installs that are regularly used against the corresponding number of installs. The left-most line running top-left to bottom-right shows programs regularly used by one install, next line two regular users, etc (code+data):

Using the merged, by program name, Ubuntu usage/Debian fault counts, I built several regression models, along with plotting the data/fits. The quality of the models was worse than the original Debian model 🙁 . Two possibilities that spring to mind are: the correlation between usage and fault reports only becomes visible when the counts are divided into short periods (perhaps a year?), or the correlation is very weak. It is probably going to take a lot of time to work through this.
Debian has cast iron rules for package growth & death
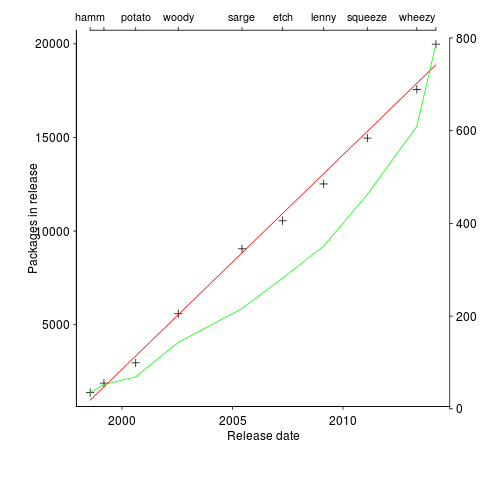
A plot in a paper on the growth of packages in Debian over the last 15 years caught my eye. The number of packages in growing approximately linear in time (fitted red line) while the total lines of code is each release (green line, axis on right in GigaSLOC) is growing non-linearly (I suspect exponential). The obvious conclusion is that the size of each package is also growing over time; rummaging through the data provided with the paper uncovered an increase in average package size from 25.6 to 39.4 KSLOC (the full dataset is being made available on the 15th of this month).

The straight line fit is excellent, explaining over 99.5% of the variance (code and data). Packages have been constantly added at the rate of 3.3 per day for over 15 years. Is there some rule that says Debian has to grow at 1,000 packages per year?
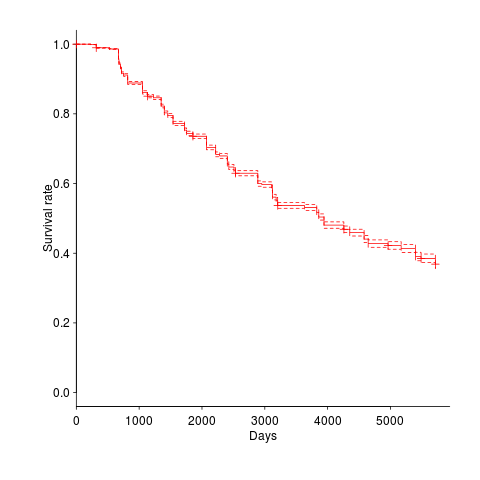
The numbers in one table showed that packages were being removed in non-trivial quantities. I wondered what the half-life of a package might be and in amongst the data provided by the paper’s authors was a list of packages shipped in each Debian release, just what was needed to create a survival curve. The answer to my package half-life question is around 11 years, as can be seen below (dashed lines are the 95% confidence interval).

Most packages survive for two Debian releases, followed by a 10% cull and then steady decline; the survival curve is slightly concave, meaning younger packages are more likely to be removed (rather than removal being age independent). An 11 year half-life corresponds to an annual removal rate of around 9%. Is this another Debian release rule, around 10% of current packages must be removed for the next release (which means they have to be replaced by an equal number of new packages to keep that steady 3.3 per day overall increase)?
Where is all the code needed to increase the size of existing packages, and create all these new packages, coming from?
Perhaps packages are being replaced by a variant of themselves, created by somebody who has jumped in with lots of ideas (and free time) about where they want to take the application.
If there are 1,000 different kinds of application, then Debian now have 20 implementations of each of them and the next release will have one new implementation for each of them and almost two of each existing implementations will be replaced.
I wonder how much of this code is copy-and-paste, we will have to wait for the release of the full dataset (and some spare time on somebodies part).
Recent Comments