Archive
Lifetime of coding mistakes in the Linux kernel
What is the lifetime of coding mistakes in the Linux kernel? Some coding mistakes result in fault reports (some of which are fixed), while many are removed when the source that contains them is deleted/changed during ongoing development.
After fixing the coding mistake(s) in the kernel that generated a reported fault, developer(s) log the commit that introduced the coding mistake, along with the commit that fixed it. This logging started in 2013, and I only found out about it this week. To be exact, I discovered the repo: A dataset of Linux Kernel commits created by Maes Bermejo, Gonzalez-Barahona, Gallego, and Robles.
The log contains the commit hashes for the 90,760 fixes made to the 63 mainline kernel versions from 3.12 to 6.13. The complete log of 1,233,421 commits has to be searched to extract the details, e.g., date, lines added, etc.
The kernel development process involves regular release cycles of around 80 days. Developers submit the code they want to be included in the next release, this goes through a series of reviews, with Linus making the final decision.
The following analysis is based on the coding mistakes introduced between successive kernel releases, e.g., version 3.13 coding mistakes are those introduced into the source between 4 Nov 2013 (the day after version 3.12 was released) and 19 Jan 2014 (when version 3.13 was released). Code will have been worked on, and mistakes created/fixed, before it reached the kernel, which ensures some level of maturity.
The number of people working with pre-release code is likely to be tiny, compared to the number running released kernels. Consequently, the characteristics of coding mistake lifetime is expected to be different pre/post release, if only because more users are likely to report more faults.
The plot below shows the pre-release daily mistake fixed density against days since start of work on the current release, the red line is a fitted regression line mapped to density (fitted regression is a biexponential; code and data):
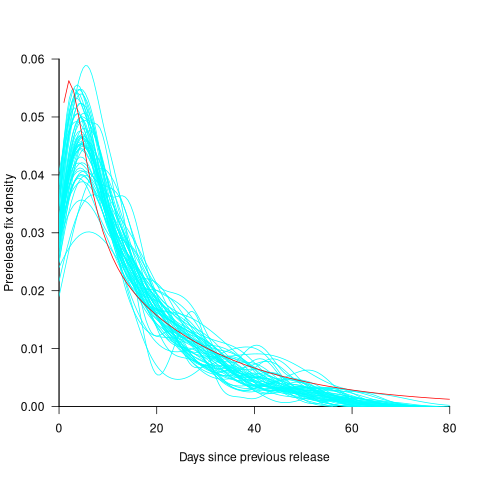
For all versions, the prior to release daily fix rate follows a consistent pattern: Most fixes occur in the first few days, with roughly an exponential decline to the release date.
The following analysis builds a broad brush model of cumulative fixes over time across 53 mainline kernel releases (the final 10 releases were not included because of their relatively short history).
The number of users of a new kernel takes time to increase as it percolates onto systems, e.g., adopted by Linux distributions and then installed by users, or installed by cloud providers. Eventually, code first included in a particular version will be running on most systems.
The post release daily fix rate is best modelled using the cumulative number of fixes, i.e., total number of fixes up to a given day since release. The models fitted below are based on dividing the post release cumulative fixes into before/after 200 days since release. The 200-day division is a round number (technically, a nearby value may provide a better fit) that supports the fitting of good quality before/after regression models. Averaged over all releases, 42% of fixes occurred within 200-days, and 58% after 200-days.
The plot below shows the cumulative number of post-release fixed faults, in red, for various kernel versions, with fitted regression lines in green and blue (grey line is at 200-days; code and data):

The equation fitted to the before 200-days fixes had the following form:
}")
where:  is a kernel version specific constant; see plot below.
The equation fitted to the after 200-days fixes had the following form:

where:  is a kernel version specific constant; see plot below.
Approximately, after release, the cumulative fix rate starts out quadratic in elapsed days, with the rate decreasing over time, until after 200-days the rate settles down to following the cube-root of days.
Comparing the number of post-release fixes across versions, there is a lot more variability in the first 200-days (i.e., the model fit to the data is sometimes very poor), relatively to after 200-days (where the model fit is consistently good).
Each kernel release has its own characteristics, parameterised by the values , and in the above equations. The plot below shows these values across versions, with red for , blue/green for , and grey line showing normalised LOC added/changed in the release (code and data):
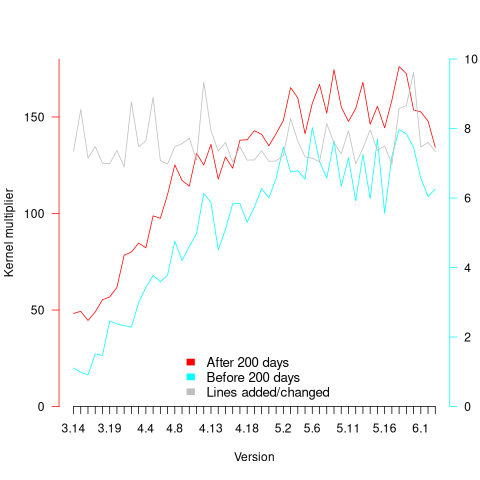
The plot clearly shows a large increase in the number of fixes between kernel version 3.14 and later versions. The before 200-days rate (blue/green) increase by a factor of seven, while the after 200-days rate increased by a factor of three.
Is this increase driven by some underlying factor in kernel development, or is it an external factor such as an increase in the number of users (more users leads to more faults reports), or the extensive post-release fuzz testing that is now common.
The number of lines of code added/changed, indicated by the grey line (shifted to fit plot axes) cannot be added to the fitted models because they exactly correlate with their respective version.
What is driving the long-term rate of fixes, i.e., cube-root of elapsed days?
Actually, what people are really want to know is what can be done to reduce the number of fixes required after release. When people ask me this, my usual reply is: “Spend more on testing”.
The probability of a coding mistake causing a fault report is decreasing: fixes reduce the number of remaining mistakes, and source added in one kernel version may be removed in a later version.
Perhaps the set of input behaviors is growing, producing the distinct conditions needed to trigger different coding mistakes, or the faults are occurring but are only reported when experienced by a small subset of users.
As always, more data is needed.
Average lines added/deleted by commits across languages
Are programs written in some programming language shorter/longer, on average, than when written in other languages?
There is a lot of variation in the length of the same program written in the same language, across different developers. Comparing program length across different languages requires a large sample of programs, each implemented in different languages, and by many different developers. This sounds like a fantasy sample, given the rarity of finding the same specification implemented multiple times in the same language.
There is a possible alternative approach to answering this question: Compare the size of commits, in lines of code, for many different programs across a variety of languages. The paper: A Study of Bug Resolution Characteristics in Popular Programming Languages by Zhang, Li, Hao, Wang, Tang, Zhang, and Harman studied 3,232,937 commits across 585 projects and 10 programming languages (between 56 and 60 projects per language, with between 58,533 and 474,497 commits per language).
The data on each commit includes: lines added, lines deleted, files changed, language, project, type of commit, lines of code in project (at some point in time). The paper investigate bug resolution characteristics, but does not include any data on number of people available to fix reported issues; I focused on all lines added/deleted. Modifying a line will be treated as an deleted/added line.
Different projects (programs) will have different characteristics. For instance, a smaller program provides more scope for adding lots of new functionality, and a larger program contains more code that can be deleted. Some projects/developers commit every change (i.e., many small commit), while others only commit when the change is completed (i.e., larger commits). There may also be algorithmic characteristics that affect the quantity of code written, e.g., availability of libraries or need for detailed bit twiddling.
It is not possible to include project-id directly in the model, because each project is written in a different language, i.e., language can be predicted from project-id. However, program size can be included as a continuous variable (only one LOC value is available, which is not ideal).
The following R code fits a basic model (the number of lines added/deleted is count data and usually small, so a Poisson distribution is assumed; given the wide range of commit sizes, quantile regression may be a better approach):
alang_mod=glm(additions ~ language+log(LOC), data=lc, family="poisson") dlang_mod=glm(deletions ~ language+log(LOC), data=lc, family="poisson") |
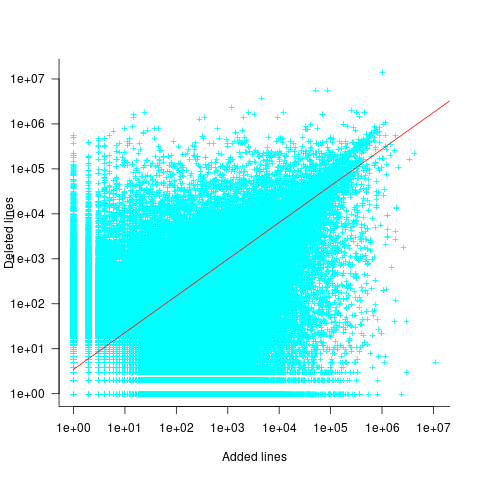
Some of the commits involve tens of thousands of lines (see plot below). This sounds rather extreme. So two sets of models are fitted, one with the original data and the other only including commits with additions/deletions containing less than 10,000 lines.
These models fit the mean number of lines added/deleted over all projects written in a particular language, and the models are multiplicative. As expected, the variance explained by these two factors is small, at around 5%. The two models fitted are (code+data):
 or
or  , and
, and  or
or  , where the value of
  is listed in the following table, and
  is the number of lines of code in the project:
                    Original          0 < lines < 10000
    Language     Added     Deleted     Added   Deleted
    C              1.0       1.0         1.0     1.0
    C#             1.7       1.6         1.5     1.5
    C++            1.9       2.1         1.3     1.4
    Go             1.4       1.2         1.3     1.2
    Java           0.9       1.0         1.5     1.5
    Javascript     1.1       1.1         1.3     1.6
    Objective-C    1.2       1.4         2.0     2.4
    PHP            2.5       2.6         1.7     1.9
    Python         0.7       0.7         0.8     0.8
Ruby 0.3 0.3 0.7 0.7 |
These fitted models suggest that commit addition/deletion both increase as project size increases, by around  , and that, for instance, a commit in Go adds 1.4 times as many lines as C, and delete 1.2 as many lines (averaged over all commits). Comparing adds/deletes for the same language: on average, a Go commit adds
  lines, and deletes
  lines.
There is a strong connection between the number of lines added/deleted in each commit. The plot below shows the lines added/deleted by each commit, with the red line showing a fitted regression model  (code+data):
What other information can be included in a model? It is possible that project specific behavior(s) create a correlation between the size of commits; the algorithm used to fit this model assumes zero correlation. The glmer function, in the R package lme4, can take account of correlation between commits. The model component (language | project) in the following code adds project as a random effect on the language variable:
del_lmod=glmer(deletions ~ language+log(LOC)+(language | project), data=lc_loc, family=poisson) |
It takes around 24hr of cpu time to fit this model, which means I have not done much experimentation…
Recent Comments