Archive
Distribution of method chains in Java and Python
Some languages support three different ways of organizing a sequence of functions/methods, with calls taking as their first argument the value returned by the immediately prior call. For instance, Java supports the following possibilities:
r1=f1(val); r2=f2(r1); r3=f3(r2); // Sequential calls r3=f3(f2(f1(val))); // Nested calls, read right to left r3=val.f1().f2().f3(); // Method chain, read left to right |
Simula 67 was the first language to support the dot-call syntax used to code method chains. Ten years later Smalltalk-76 supported sending a message to the result of a prior send, which could be seen as a method chain rather than a nested call (because it is read left to right; Smalltalk makes minimal use of punctuator characters, so the syntax is not distinguishable).
How common are method chains in source code, and what is the distribution of chain length? Two studies have investigated this question: An Empirical Study of Method Chaining in Java by Nakamaru (PhD thesis), Matsunaga, Akiyama, Yamazaki, and Chiba, and Method Chaining Redux: An Empirical Study of Method Chaining in Java, Kotlin, and Python by Keshk, and Dyer.
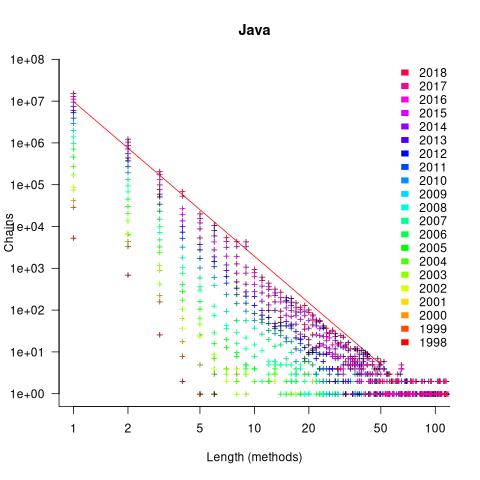
The plot below shows the number of Java method chains having a given length, for code available in a given year. The red line is a fitted regression line for 2018, based on a model fitted to the complete dataset (code and data):

The fitted regression model is:

Why is the number of chains of all lengths growing by around 46% per year? I think this growth is driven by the growth in the amount of source measured. Measurements show that the percentage of source lines containing a method call is roughly constant. In the plot above, the number of unchained methods (i.e., chains of length one) increases in-step with the growth of chained methods. All chain lengths will grow at the same rate, if the source that contains them is growing.
What is responsible for the step change in the number of chains at around 10 methods? Nakamaru classified a random sample of 280 chains, and found that roughly 80% of chains longer than eight methods built an object, e.g., the following chain:
MoreObjects.toStringHelper(this) .add("iLine" , iLine) .add("lastK" , lastK) .add("spacesPending", spacesPending) .add("newlinesPending", newlinesPending) .add("blankLines", blankLines) .add("super", super.toString()) .toString() |
Are these chain usage patterns present in Python? The plot below shows the number of Python method chains having a given length, for code available in a given year. The red line is a fitted regression line for 2020, based on a model fitted to the complete dataset (code and data):

The fitted regression model is:

While this model is almost identical to the model fitted to the Java data (the annual growth rate is 39%), the above plot shows a large step change after chains of length two. Keshk’s paper focuses on replicating Nakamaru’s Java results, and then briefly discusses Python. I have an assortment of explanations, but nothing stands out.
Within code, how are method calls split between single calls and a chain of two or more calls?
The fractions in the plot below are calculated as the ratio of chains of length one (i.e., single method call) against chains containing two or more methods. The “j” shows Java ratios, and “p” Python ratios. The red lines show the fraction based on the total number of method calls, and the blue/green lines are based on occurrences of chains, i.e., chain of one vs chain of many (code and data):

The ratio of Java chains containing two or more methods vs one method, grew by around 6% a year between 2006 and 2018, which is only a small part of the overall 46% annual Java growth.
Method chaining is three times more common in Java than Python. In 2020 around a quarter of all method calls were in a chain of two or more, and single method calls were around ten times more common than multi-call chains.
In Python, the use of method chains has roughly remained unchanged over 15 years, with around 5% of all method calls appearing in a chain.
I don’t have a good idea for why method chains are three times more common in Java than Python. Are nested calls the more common usage in Python, or do developers use a sequence of calls communicating using temporary variables?
What of languages that don’t support method chaining, e.g., C. Is the distribution of the number of nested calls (or sequence of calls using temporaries) a power law with an exponent close to 3.7?
Suggestions and pointers to more data welcome.
Measuring non-determinism in the Linux kernel
Developers often assume that it’s possible to predict the execution path a program will take, for a given set of input values, i.e., program behavior is deterministic. The execution path may be very complicated, and may depend on the contents of certain files (e.g., SQL engines), but it’s deterministic.
There is one kind of program where determinism is not an option; operating systems are non-deterministic when running in a mode where interrupts can occur.
How much non-determinism can occur in, say, Linux? For instance, when a program calls a system function (e.g., open, read, write, close), how often does the execution sequence follow the function call tree that appears in the source code, and how many different call sequences actually occur during program execution (because of diversions caused by an interrupt; ignoring control flow within functions)?
A study by Imanol Allende ran the same program 500K+ times, and traced every function call that occurred within the Linux kernel (thanks to Imanol for sending me the data and answering my questions). The program used appears below; the system calls traced were open (two distinct calls), read, write, and close (two distinct calls); a total of six system calls.
// #includes omitted int main(int argc, char **argv) { unsigned char result; int fd1, fd2, ret; char res_str[10]={0}; fd1 = open("/dev/urandom", O_RDONLY); fd2 = open("/dev/null", O_WRONLY); ret = read(fd1 , &result, 1); sprintf(res_str ,"%d", result); ret = write(fd2, res_str, strlen(res_str)); close(fd1); close(fd2); return ret; } |
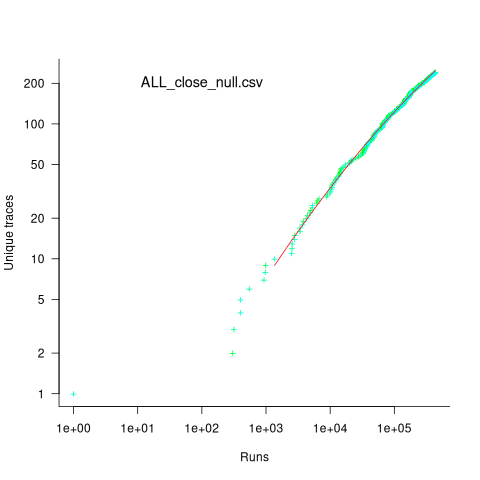
Analysing each of these six distinct calls, in around 98% of program runs, each call follows the same sequence of function calls within the kernel (the common case for write involves a chain of around 10 function calls). During the other 2’ish% of calls, the common sequence was interrupted for some reason, and the logged call trace includes additional called functions, e.g., calls involving the Read, Copy, Update synchronization mechanism. The plot below shows the growth in the number of unique traces against the number of program runs (436,827 of them) for the close(fd2) call; a fitted regression line is in red, with the first 1,000 runs not included in the fit (code+data):

The fitted regression model is  , suggesting that the growth in unique traces is slowing (this equation peaks at around
  ), while the model fitted to some of the system calls implies ever continuing growth.
Allende investigated more sophisticated techniques for estimating the total number of unique traces, including: extreme value theory and species estimation techniques from ecology.
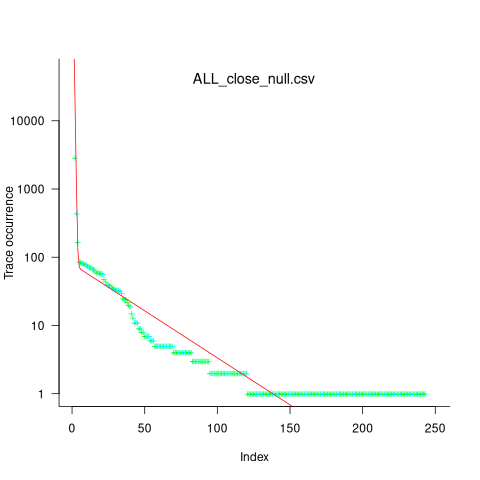
While around 98% of traces are the common case, over half of the unique traces occurred once in 436,827 runs. The plot below shows the number of occurrences of each unique trace, for the close(fd2) call, with an attempted fit of a bi-exponential model (in red; code+data):

The analysis above looked at one system call, the program contains six system calls. If, for each system call, the probability of the most common trace is 98%, then the probability of all six calls following their respective common case is 89%. As the number of distinct system calls made by a program goes up, the global common case becomes less common, and the number of distinct program traces increases multiplicatively.
Recent Comments