Archive
A process to find and extract data-points from graphs in pdf files
Ever since I discovered that it’s sometimes possible to extract the x/y values of the points/circles/diamonds appearing in a graph, within a pdf, I have been trying to automate the process.
Within a pdf there are two ways of encoding an image, such as the one below. The information can be specified using a graphics image format (e.g., jpeg, png, or svg), or it can be specified using a sequence of pdf’s internal virtual machine instructions.

After spotting an interesting graph containing data points, when reading a paper, the quickest way to find out whether the image is embedded in the pdf as an image file (the most common case) is to run pdfcpu (using the options extract -m image). If the graph is not contained in the image files extracted by pdfcpu, it may have been created using internal pdf commands (or be a format not yet support by pdfcpu).
Until recently, finding the sequence of internal pdf instructions used to visualise a particular graph was a tedious process. A few months ago, I discovered the tool pdfsyntax, which has an option to convert the pdf internals into a html page containing links between the various components (making it easy to go to a particular page and view the contents). However, pdfsyntax is still new, i.e., it regularly fails to convert a pdf file.
As distributed, pdf files are compressed. They can be converted to readable form using the command qpdf –stream-data=uncompress (images remain in their respective binary format). To locate the instructions that generate a graph, I search for a sequence of 3-4 characters appearing close to the graph in the displayed text (it is difficult to predict how words will be split for layout purposes, within a pdf). The instructions that generate the graph may appear later in the uncompressed file, with a named reference to these instructions appearing around this text (i.e., a pdf function call). LLM’s are great at describing the behavior of sequences of pdf instructions.
Why not grep uncompressed pdf files to find those containing the instructions used to generate graphs?
Surprisingly, apps that produce pdf files use a myriad of different instruction sequences to draw circles, diamonds, pluses, etc. While there is a pdf instruction to draw a circle, the most common technique uses four Bézier curves to draw each quadrant of a circle; a colored circle might be drawn by filling a specified area with a chosen color. The plus (+) symbol is sometimes drawn as a vertical line followed by a horizontal line (or the other order), and sometimes all the vertical lines are drawn followed by all the horizontal lines. Diamonds are created using four angled lines.
Fewer combinations of instructions are used to draw the values associated with the axis ticks, e.g., 10, 20, 30, etc.
The output from my script that searches pdf files for possible extractable data lists the line numbers of possible data points and possible tick labels, along with the totals for each. A graph will usually contain many points and 10+ labels. Lower totals usually suggest incidental matches.
If an appropriate instruction sequence is found, it is copied to a file, and a bespoke awk script (usually an edited version of a previous script) extracts the numeric values within the reference frame of the graph axis bounds. This extraction process first calculates the x/y coordinates of the center of the circle/diamond/plus, in the pdf frame, then calculates the x/y coordinates of the axis tick marks, in the pdf frame, then maps the x/y data points to the axis frame.
I’m not expecting the extraction of numeric values to have any degree of automation anytime soon. But then, this problem would make a great challenge for LLM coding apps…
When a graph is specified using an image format, WebPlotDigitizer is the extraction tool of choice.
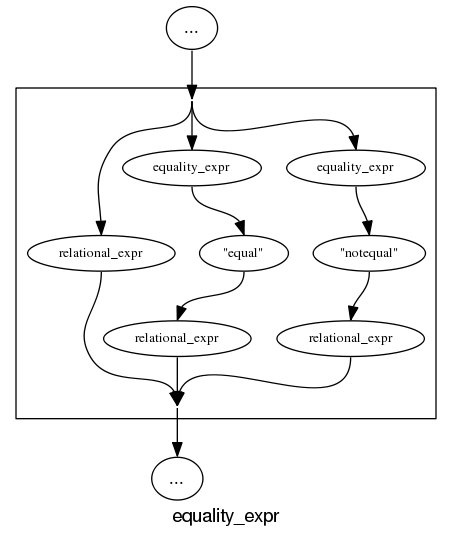
Automatically generating railroad diagrams from yacc files
Reading and understanding a language’s syntax written in the BNF-like notation used by yacc/bison takes some practice. Railroad diagrams are a much more user friendly notation, but require a lot of manual tweaking before they look as good as the following example from the json.org website:
I’m currently working on a language whose syntax is evolving and I want to create a visual representation of it that can be read by non-yacc experts; spending a day of so manually creating a decent looking railroad diagram is not an efficient use of time. What automatic visualization tools are out there that I can use?
A couple of tools that look like they might produce useful results are web based (e.g., bottlecaps.de; working on an internal project for a company means I cannot take this approach). Some tools take EBNF as input (e.g., my28msec.com which is also online based); the Extensions in EBNF obviate the need for many of the low level organizational details that appear in grammars written with BNF, making grammars written using EBNF easier to layout and look good; great if I was working with EBNF. The yacc file input tools I tried (yaccviso, Vyacc) were a bit too fragile and the output was not that good.
Bison has an option to generate a output that can be processed into graphical form (using graphviz as the layout engine). Unfortunately the graphs produced are as visually tangled as the input grammar and if anything harder to follow.
It is possible to produce great looking visual diagrams using a simple tool if you are willing to spend lots of fiddling with the input grammar to control the output. I wanted to take the grammar as written (i.e., a yacc input file) and am willing to accept less than perfect output.
Most of the syntax rules in a yacc grammar are straight forward sequences of tokens that have an obvious one-to-one mapping and there are a few commonly seen idioms. I decided to write a tool that concentrated on untangling the idioms and let the simple stuff look after itself. One idiom that has a visual representation very different from its yacc form is the two productions used to specify an arbitrary long list, e.g., a semicolon separated list of ys is often written as (ok, there might perhaps be times when right recursion is appropriate):
x : y | x ";" y ; |
and I wanted something that looked like (from the sql-lite web site, which goes one better and allows support for the list to be optional:
Graph layout is a complicated business and like everybody else I decided to use graphviz to do the heavy lifting (specifically I would generate the layout directives used by dot). All I had to do was write a yacc grammar to dot translator (and not spend lots of time doing it).
The dot language provides a directives that specify the visual properties of nodes and the connections between them. For instance:
n_0[shape=point] n_1[label="sql-stmt"] n_2[label=";"] n_3[shape=point] n_0 -> n_3 n_0 -> n_1 n_1 -> n_3 n_1 -> n_2 n_2 -> n_1 |
is the dot specification of the optional semicolon separated list of sql-stmts displayed above.
Dot takes a list of directives describing the nodes and edges of a graph and makes its own decisions about how to layout the output. It is possible to specify in excruciating detail exactly how to do the layout, but I wanted everything to be automated.
I decided to write the tool in awk because it has great input token handling facilities and I use it often enough to be fluent.
Each grammar rule containing one or more productions is mapped to a single graph. When generating postscript dot puts each graph on a separate page, other output formats appear to loose all but one of the graphs. To make sure each rule fitted on a page I had the text point size depend on the number of productions in a rule, more productions smaller point size. The most common idioms are handled (i.e., list-of and optional construct) with hooks available to handle others. Productions within a rule will often have common token sequences but the current version only checks for matching token sequences at the start of a production and all productions in a rule have to start with the same sequence. Words written all in upper-case are assumed to be language tokens and are converted to lower case and bracketed with quotes. The 300+ lines of conversion tool’s awk source is available for download.
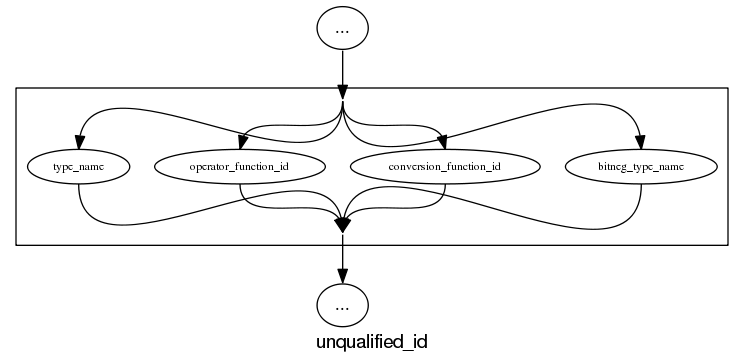
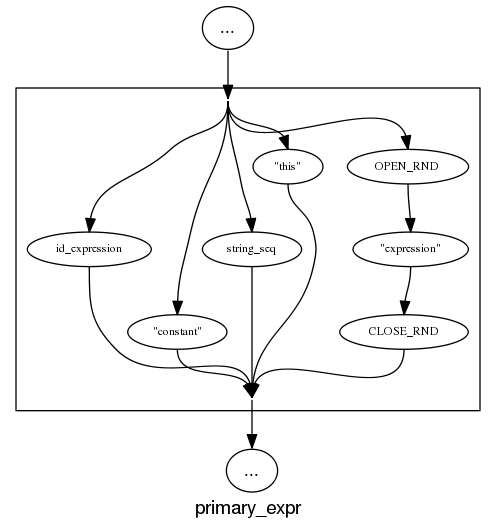
The follow examples are taken from an attempted yacc grammar of C++ done when people still thought such a thing could be created. While the output does have a certain railroad diagram feel to it, the terrain must be very hilly to generate those curvaceous lines.
and the run of the mill rules look good, a C++ primary-expression is:
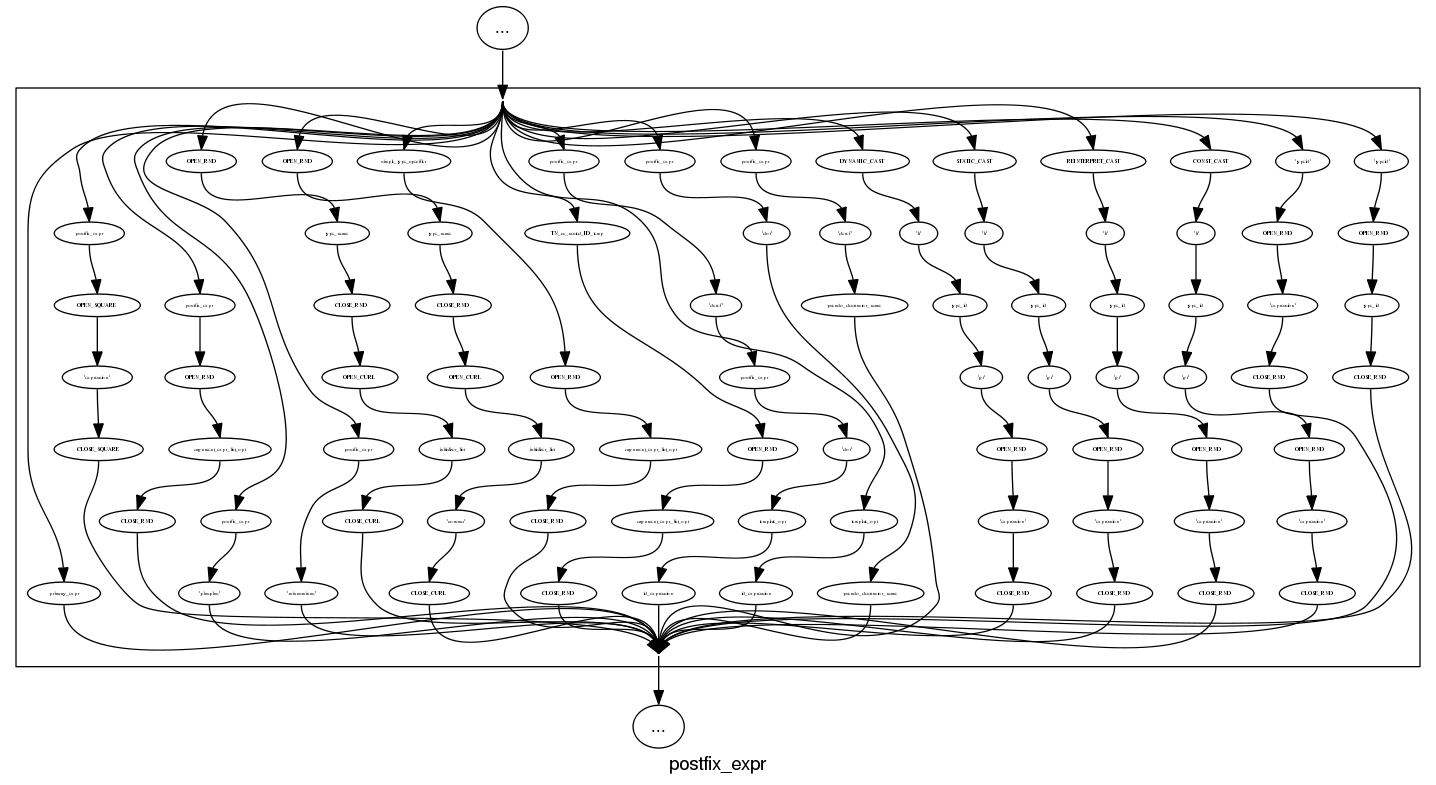
and we can rely on C++ to push syntax rule complexity to the limit, a postfix-expression is:
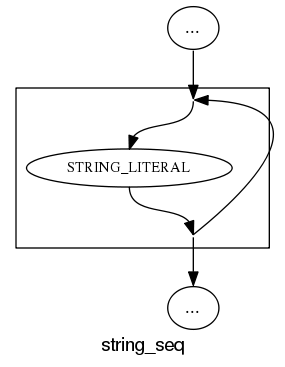
What about the idioms? A simple list of items looks good:
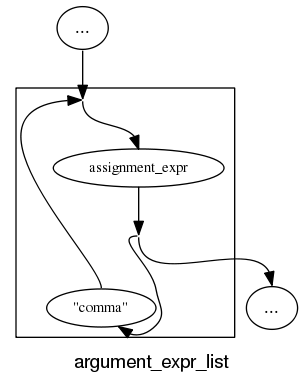
and slightly less good when separators are involved:
and if we push our luck things start to look tangled:
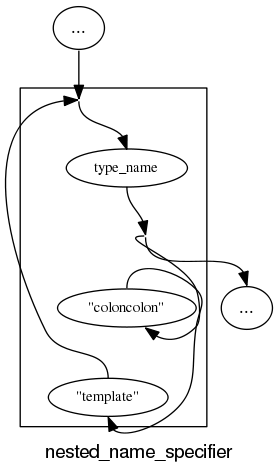
With a bit more work invested on merging token sequences common to two or more rules the following might look a lot less cluttered:
Apart from a few tangled cases the results are not bad for a tool that was a few hours work. I will wait a bit to see if the people I deal with find this visual form of use.
In the meantime I would be interested to hear about my readers experience with visualizing grammars, using dot to this kind of thing and any suggestions they have. As a long time user of dot I know that there are lots of ways of influencing the final layout (e.g., changing the ordering or edges and nodes in its input), I will have to be careful not to get pulled down this rabbit hole.
Number of possible different one line programs
Writing one line programs is a popular activity in some programming languages (e.g., awk and Perl). How many different one line programs is it possible to write?
First we need to get some idea of the maximum number of characters that written on one line. Microsoft Windows XP or later has a maximum command line length of 8191 characters, while Windows 2000 and Windows NT 4.0 have a 2047 limit. POSIX requires that _POSIX2_LINE_MAX have a value of at least 2048.
In 2048 characters it is possible to assign values to and use at least once 100 different variables (e.g., a1=2;a2=2.3;....; print a1+a2*a3...). To get a lower bound lets consider the number of different expressions it is possible to write. How many functionally different expressions containing 100 binary operators are there?
If a language has, say, eight binary operators (e.g., +, -, *, /, %, &, |, ^), then it is possible to write  visually different expressions containing 100 binary operators. Some of these expressions will be mathematically equivalent (adopting the convention of leaving out the operands), e.g.,
 + * can also be written as * + (the appropriate operands will also have the be switched around).
If we just consider expressions created using the commutative operators (i.e., +, *, &, |, ^), then with these five operators it is possible to write 1170671511684728695563295535920396 mathematically different expressions containing 100 operators (assuming the common case that the five operators have different precedence levels, which means the different expressions have a one to one mapping to a rooted tree of height five); this  is a lot smaller than
  .
.
Had the approximately  computers/smart phones in the world generated expressions at the rate of
  per second since the start of the Universe,
  seconds ago, then the
  created so far would be almost half of the total possible.
Once we start including the non-commutative operators such a minus and divide the number of possible combinations really starts to climb and the calculation of the totals is real complicated. Since the Universe is not yet half way through the commutative operators I will leave working this total out for another day.
Update (later in the day)
To get some idea of the huge jump in number of functionally different expressions that occurs when operator ordering is significant, with just the three operators -, / and % is is possible to create  mathematically different expressions. This is a factor of
  greater than generated by the five operators considered above.
If we consider expressions containing just one instance of the five commutative operators then the number of expressions jumps by another two orders of magnitude to  . This count will continue to increase for a while as more commutative operators are added and then start to decline; I have not yet worked things through to find the maxima.
Update (April 2012).
Sequence A140606 in the On-Line Encyclopedia of Integer Sequences lists the number of inequivalent expressions involving n operands; whose first few values are: 1, 6, 68, 1170, 27142, 793002, 27914126, 1150212810, 54326011414, 2894532443154, 171800282010062, 11243812043430330, 804596872359480358, 62506696942427106498, 5239819196582605428254, 471480120474696200252970, 45328694990444455796547766, 4637556923393331549190920306
Recent Comments