Measuring non-determinism in the Linux kernel
Developers often assume that it’s possible to predict the execution path a program will take, for a given set of input values, i.e., program behavior is deterministic. The execution path may be very complicated, and may depend on the contents of certain files (e.g., SQL engines), but it’s deterministic.
There is one kind of program where determinism is not an option; operating systems are non-deterministic when running in a mode where interrupts can occur.
How much non-determinism can occur in, say, Linux? For instance, when a program calls a system function (e.g., open, read, write, close), how often does the execution sequence follow the function call tree that appears in the source code, and how many different call sequences actually occur during program execution (because of diversions caused by an interrupt; ignoring control flow within functions)?
A study by Imanol Allende ran the same program 500K+ times, and traced every function call that occurred within the Linux kernel (thanks to Imanol for sending me the data and answering my questions). The program used appears below; the system calls traced were open (two distinct calls), read, write, and close (two distinct calls); a total of six system calls.
// #includes omitted int main(int argc, char **argv) { unsigned char result; int fd1, fd2, ret; char res_str[10]={0}; fd1 = open("/dev/urandom", O_RDONLY); fd2 = open("/dev/null", O_WRONLY); ret = read(fd1 , &result, 1); sprintf(res_str ,"%d", result); ret = write(fd2, res_str, strlen(res_str)); close(fd1); close(fd2); return ret; } |
Analysing each of these six distinct calls, in around 98% of program runs, each call follows the same sequence of function calls within the kernel (the common case for write involves a chain of around 10 function calls). During the other 2’ish% of calls, the common sequence was interrupted for some reason, and the logged call trace includes additional called functions, e.g., calls involving the Read, Copy, Update synchronization mechanism. The plot below shows the growth in the number of unique traces against the number of program runs (436,827 of them) for the close(fd2) call; a fitted regression line is in red, with the first 1,000 runs not included in the fit (code+data):
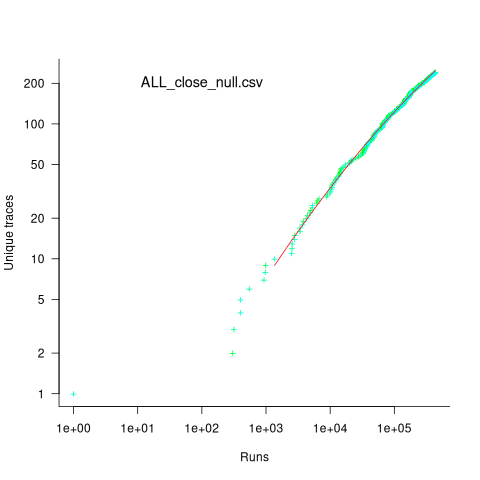
The fitted regression model is ^2") , suggesting that the growth in unique traces is slowing (this equation peaks at around
, suggesting that the growth in unique traces is slowing (this equation peaks at around  ), while the model fitted to some of the system calls implies ever continuing growth.
Allende investigated more sophisticated techniques for estimating the total number of unique traces, including: extreme value theory and species estimation techniques from ecology.
While around 98% of traces are the common case, over half of the unique traces occurred once in 436,827 runs. The plot below shows the number of occurrences of each unique trace, for the close(fd2) call, with an attempted fit of a bi-exponential model (in red; code+data):
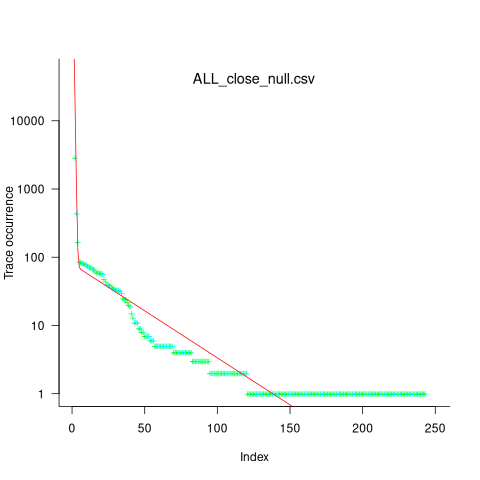
The analysis above looked at one system call, the program contains six system calls. If, for each system call, the probability of the most common trace is 98%, then the probability of all six calls following their respective common case is 89%. As the number of distinct system calls made by a program goes up, the global common case becomes less common, and the number of distinct program traces increases multiplicatively.
Recent Comments