Memory bandwidth: 1991-2009
The Stream benchmark is a measure of sustained memory bandwidth; the target systems are high performance computers. Sustained in the sense of distance running, rather than a short sprint (the term for this is peak memory bandwidth and occurs when the requested data is in cache), and bandwidth in the sense of bytes of memory read/written per second (implemented using chunks the size of a double precision floating-point type). The dataset contains 1,018 measurements collected between 1991 and 2009.
The dominant characteristic of high performance computing applications is looping over very large arrays, performing floating-point operations on all the elements. A fast floating-point arithmetic unit has to be connected to a memory subsystem that can keep it fed with new floating-point values and write back computed values.
The Stream benchmark, in Fortran and C, defines several arrays, each containing max(1e6, 4*size_of_available_cache) double precision floating-point elements. There are four loops that iterate over every element of the arrays, each loop containing a single statement; see Fortran code in the following table (q is a scalar, array elements are usually 8-bytes, with add/multiply being the floating-point operations):
Name Operation Bytes FLOPS Copy a(i) = b(i) 16 0 Scale a(i) = q*b(i) 16 1 Sum a(i) = b(i) + c(i) 24 1 Triad a(i) = b(i) + q*c(i) 24 2 |
A system’s memory bandwidth will depend on the speed of the DRAM chips, the performance of the devices that transport bytes to the cpu, and the ability of the cpu to handle incoming traffic. The Stream data contains 21 columns, including: the vendor, date, clock rate, number of cpus, kind of memory (i.e., shared/distributed), and the bandwidth in megabytes/sec for each of the operations listed above.
How does the measured memory bandwidth change over time?
For most of the systems, the values for each of Copy, Scale, Sum, and Triad are very similar. That the simplest statement, Copy, is sometimes a bit faster/slower than the most complicated statement, Triad, shows that floating-point performance is much smaller than the time taken to read/write values to memory; the performance difference is random variation.
Several fitted regression models explain over half of the variance in the data, with the influential explanatory variables being: clock speed, date, type of system (i.e., PC/Mac or something much more expensive). The plot below shows MB/sec for the Copy loop, with three fitted regression models (code+data):
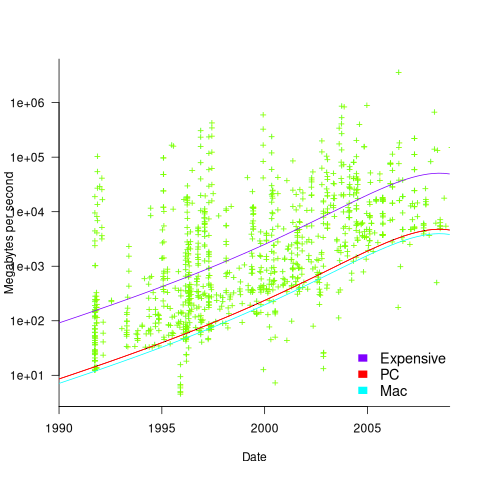
Fitting these models first required fitting a model for cpu clock rate over time; predictions of mean clock rate over time are needed as input to the memory bandwidth model. The three bandwidth models fitted are for PCs (189 systems), Macs (39 systems), and the more expensive systems (785; the five cluster systems were not fitted).
There was a 30% annual increase in memory bandwidth, with the average expensive systems having an order of magnitude greater bandwidth than PCs/Macs.
Clock rates stopped increasing around 2010, but go faster DRAM standards continue to be published. I assume that memory bandwidth continues to increase, but that memory performance is not something that gets written about much. The memory bandwidth on my new system is  MB/sec. This 2024 sample of one is 3.5 times faster than the average 2009 PC bandwidth, which is 100 times faster than the 1991 bandwidth.
The LINPACK benchmarks are the traditional application oriented cpu benchmarks used within the high performance computer community.
Recent Comments