Program fault reports are caused by its users
Faults are generated by users of the software; no users, no fault reports. Fault reports will be generated for software that is free of coding mistakes; one study found that 42.6% of fault reports were misclassified as either requests for an enhancement, changes to documentation, or a refactoring request, or not requiring changes to the code; a study of NASA spaceflight software found that 63% of reports in the defect tracking tool were change requests.
Is the number of reported faults proportional to the number of users, the log of the number of users, or perhaps it depends on the application, or who knows what?
Some users will only use some features, others other features. Some users will be occasional users, while some will be heavy users.
There are a handful of fault report datasets containing measurements of software usage. The largest, and most widely cited, is “Optimizing Preventive Service of Software Products” by E. N. Adams. The data is this paper lists the number of faults reported in eight time intervals (20 to 50,000 months), for nine applications running on IBM mainframes between 1975 and 1980. Traditionally, the licensing for many Mainframe applications charge customers a fee based on their usage. Does this usage data still exist? Perhaps there is some sitting on a shelf in court documents. Pointers to possible cases most welcome.
Early papers on software testing sometimes measured the amount of cpu, or elapsed time, between each fault experience. However, the raw data was rarely published.
Data is available, for the Debian and Ubuntu distributions, on the number of installs for each application (counts rely on local machine sending information on installs, which is now an opt-in process for Ubuntu).
The following analysis uses data from the paper Impact of Installation Counts on Perceived Quality: A Case Study on Debian by Herraiz, Shihab, Nguyen, and Hassan, and the Ubuntu popularity project.
The plot below shows the number of reported faults against number of installs for the 14,565 programs in the “wheezy” Debian release; red line is the fitted power law:  (code+data):
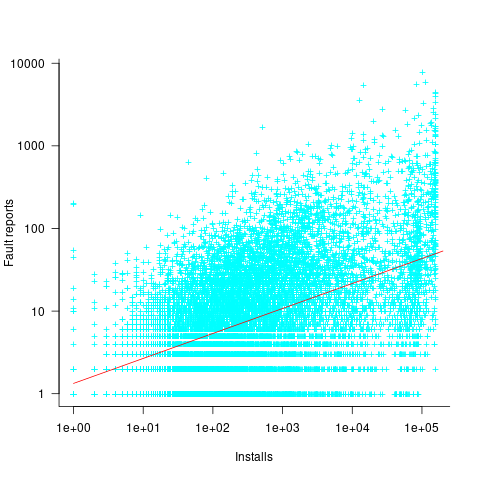
The huge variability in the number of fault reports for a given number of installs is likely driven by variability in the usage of the installed programs (or even no usage; I installed ImageMagick purely to use its convert program), the propensity of users of particular programs to report fault experiences (which in turn depends on the need for a fix, and the ease of reporting), and the number of coding faults in the source code.
The Debian installs/faults data does not include any usage information, however, the Ubuntu popularity data includes not only a count of installs, but the corresponding counts of regular users and non-usages. Given that Ubuntu is a fork of Debian, and has substantial usage, I’m assuming that the user base is sufficiently similar that the Ubuntu usage data at the time of the “wheezy” release can be applied to the “wheezy” Debian install/fault data.
The plot below shows, for 220,309 programs, the fraction of installs that are regularly used against the corresponding number of installs. The left-most line running top-left to bottom-right shows programs regularly used by one install, next line two regular users, etc (code+data):

Using the merged, by program name, Ubuntu usage/Debian fault counts, I built several regression models, along with plotting the data/fits. The quality of the models was worse than the original Debian model 🙁 . Two possibilities that spring to mind are: the correlation between usage and fault reports only becomes visible when the counts are divided into short periods (perhaps a year?), or the correlation is very weak. It is probably going to take a lot of time to work through this.
Recent Comments