Archive
Including natural language text topics in a regression model
The implementation records for a project sometimes include a brief description of each task implemented. There will be some degree of similarity between the implementation of some tasks. Is it possible to calculate the degree of similarity between tasks from the text in the task descriptions?
Over the years, various approaches to measuring document similarity have been proposed (more than you probably want to know about natural language processing).
One of the oldest, simplest and widely used technique is term frequency–inverse document frequency (tf-idf), which is based on counting word frequencies, i.e., is word context is ignored. This technique can work well when there are a sufficient number of words to ensure a good enough overlap between similar documents.
When the description consists of a sentence or two (i.e., a summary), the problem becomes one of sentence similarity, not document similarity (so tf-idf is unlikely to be of any use).
Word context, in a sentence, underpins the word embedding approach, which represents a word by an n-dimensional vector calculated from the local sentence context in which the word occurs (derived from a large amount of text). Words that are closer, in this vector space, are expected to have similar meanings. One technique for calculating the similarity between sentences is to compare the averages of the word embedding of the words they contain. However, care is needed; words appearing in the same context can create sentences having different meanings, as in the following (calculated sentence similarity in the comments):
import spacy nlp=spacy.load("en_core_web_md") # _md model needed for word vectors nlp("the screen is black").similarity(nlp("the screen is white")) # 0.9768339369182919 # closer to 1 the more similar the sentences nlp("implementing widgets would be little effort").similarity(nlp("implementing widgets would be a huge effort")) # 0.9636533803238744 nlp("the screen is black").similarity(nlp("implementing widgets would be a huge effort")) # 0.6596892830922606 |
The first pair of sentences are similar in that they are about the characteristics of an object (i.e., its colour), while the second pair are similar in that are about the quantity of something (i.e., implementation effort), and the third pair are not that similar.
The words in a document, or summary, are about some collection of topics. A set of related documents are likely to contain a discussion of a set of related topics in varying degrees. Latent Dirichlet allocation (LDA) is a widely used technique for calculating a set of (unseen) topics from a set of documents and their contained words.
A recent paper attempted to estimate task effort based on the similarity of the task descriptions (using tf-idf). My last semi-serious attempt to extract useful information from text, some years ago, was a miserable failure (it’s a very hard problem). Perhaps better techniques and tools are now available for me to leverage (my interest is in understanding what is going on, not making predictions).
My initial idea was to extract topics from task data, and then try to add these to regression models of task effort estimation, to see what impact they had. Searching to find out what researchers have recently been doing in this area, I was pleased to see that others were ahead of me, and had implemented R packages to do the heavy lifting, in particular:
- The
stmpackage supports the creation of Structural Topic Models; these add support for covariates to influence the process of fitting LDA models, i.e., a correlation between the topics and other variables in the data. Uses of STM appear to be oriented towards teasing out differences in topics associated with different values of some variable (e.g., political party), and the package authors have written papers analysing political data. - The
psychtmpackage supports what the authors call supervised latent Dirichlet allocation with covariates (SLDAX). This handles all the details needed to include the extracted LDA topics in a regression model; exactly what I was after. The user interface and documentation for this package is not as polished as thestmpackage, but the code held together as I fumbled my way through.
To experiment using these two packages I used the SiP dataset, which includes summary text for each task, and I have previously analysed the estimation task data.
The stm package:
The textProcessor function handles all the details of converting a vector of strings (e.g., summary text) to internal form (i.e., handling conversion to lower case, removing stop words, stemming, etc).
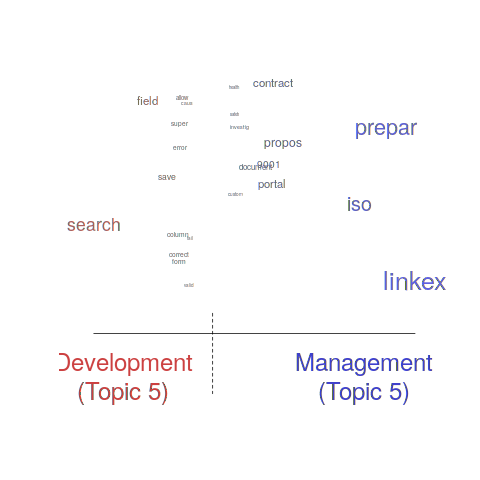
One of the input variables to the LDA process is the number of topics to use. Picking this value is something of a black art, and various functions are available for calculating and displaying concepts such as topic semantic coherence and exclusivity, the most commonly used words associated with a topic, and the documents in which these topics occur. Deciding the extent to which 10 or 15 topics produced the best results (values that sounded like a good idea to me) required domain knowledge that I did not have. The plot below shows the extent to which the words in topic 5 were associated with the Category column having the value “Development” or “Management” (code+data):
The psychtm package:
The prep_docs function is not as polished as the equivalent stm function, but the package’s first release was just last year.
After the data has been prepared, the call to fit a regression model that includes the LDA extracted topics is straightforward:
sip_topic_mod=gibbs_sldax(log(HoursActual) ~ log(HoursEstimate), data = cl_info,
                         docs = docs_vocab$documents, model = "sldax",
K = 10 # number of topics) |
where: log(HoursActual) ~ log(HoursEstimate) is the simplest model fitted in the original analysis.
The fitted model had the form:  , with the calculated coefficient for some topics not being significant. The value
  is close to that fitted in the original model. The value of
  is the fraction of the calculated to be present in the Summary text of the corresponding task.
I’m please to see that a regression model can be improved by adding topics derived from the Summary text.
The SiP data includes other information such as work Category (e.g., development, management), ProjectCode and DeveloperId. It is to be expected that these factors will have some impact on the words appearing in a task Summary, and hence the topics (the stm analysis showed this effect for Category).
When the model formula is changed to: log(HoursActual) ~ log(HoursEstimate)+ProjectCode, the quality of fit for most topics became very poor. Is this because ProjectCode and topics conveyed very similar information, or did I need to be more sophisticated when extracting topic models? This needs further investigation.
Can topic models be used to build prediction models?
Summary text can only be used to make predictions if it is available before the event being predicted, e.g., available before a task is completed and the actual effort is known. My interest in model building is to understand the processes involved, so I am not worried about when the text was created.
My own habit is to update, or even create Summary text once a task is complete. I asked Stephen Cullen, my co-author on the original analysis and author of many of the Summary texts, about the process of creating the SiP Summary sentences. His reply was that the Summary field was an active document that was updated over time. I suspect the same is true for many task descriptions.
Not all estimation data includes as much information as the SiP dataset. If Summary text is one of the few pieces of information available, it may be possible to use it as a proxy for missing columns.
Perhaps it is possible to extract information from the SiP Summary text that is not also contained in the other recorded information. Having been successful this far, I will continue to investigate.
Tracking software evolution via its Changelog
Software that is used evolves. How fast does software evolve, e.g., much new functionality is added and how much existing functionality is updated?
A new software release is often accompanied by a changelog which lists new, changed and deleted functionality. When software is developed using a continuous release process, the changelog can be very fine-grained.
The changelog for the Beeminder app contains 3,829 entries, almost one per day since February 2011 (around 180 entries are not present in the log I downloaded, whose last entry is numbered 4012).
Is it possible to use the information contained in the Beeminder changelog to estimate the rate of growth of functionality of Beeminder over time?
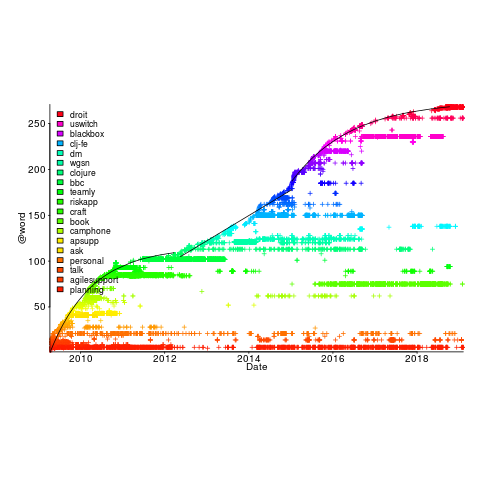
My thinking is driven by patterns in a plot of the Renzo Pomodoro dataset. Renzo assigned a tag-name (sometimes two) to each task, which classified the work involved, e.g., @planning. The following plot shows the date of use of each tag-name, over time (ordered vertically by first use). The first and third black lines are fitted regression models of the form  , where:
  is a constant and
  is the number of days since the start of the interval fitted; the second (middle) black line is a fitted straight line.
How might a changelog line describing a day’s change be distilled to a much shorter description (effectively a tag-name), with very similar changes mapping to the same description?
Named-entity recognition seemed like a good place to start my search, and my natural language text processing tool of choice is still spaCy (which continues to get better and better).
spaCy is Python based and the processing pipeline could have all been written in Python. However, I’m much more fluent in awk for data processing, and R for plotting, so Python was just used for the language processing.
The following shows some Beeminder changelog lines after stripping out urls and formatting characters:
Cheapo bug fix for erroneous quoting of number of safety buffer days for weight loss graphs. Bugfix: Response emails were accidentally off the past couple days; fixed now. Thanks to user bmndr.com/laur for alerting us! More useful subject lines in the response emails, like "wrong lane!" or whatnot. Clearer/conciser stats at bottom of graph pages. (Will take effect when you enter your next datapoint.) Progress, rate, lane, delta. Better handling of significant digits when displaying numbers. Cf stackoverflow.com/q/5208663 |
The code to extract and print the named-entities in each changelog line could not be simpler.
import spacy import sys nlp = spacy.load("en_core_web_sm") # load trained English pipelines count=0 for line in sys.stdin: count += 1 print(f'> {count}: {line}') # doc=nlp(line) # do the heavy lifting # for ent in doc.ents: # iterate over detected named-entities print(ent.lemma_, ent.label_) |
To maximize the similarity between named-entities appearing on different lines the lemmas are printed, rather than original text (i.e., words appear in their base form).
The label_ specifies the kind of named-entity, e.g., person, organization, location, etc.
This code produced 2,225 unique named-entities (5,302 in total) from the Beeminder changelog (around 0.6 per day), and failed to return a named-entity for 33% of lines. I was somewhat optimistically hoping for a few hundred unique named-entities.
There are several problems with this simple implementation:
- each line is considered in isolation,
- the change log sometimes contains different names for the same entity, e.g., a person’s full name, Christian name, or twitter name,
- what appear to be uninteresting named-entities, e.g., numbers and dates,
- the language does not know much about software, having been training on a corpus of general English.
Handling multiple names for the same entity would a lot of work (i.e., I did nothing), ‘uninteresting’ named-entities can be handled by post-processing the output.
A language processing pipeline that is not software-concept aware is of limited value. spaCy supports adding new training models, all I need is a named-entity model trained on manually annotated software engineering text.
The only decent NER training data I could find (trained on StackOverflow) was for BERT (another language processing tool), and the data format is very different. Existing add-on spaCy models included fashion, food and drugs, but no software engineering.
Time to roll up my sleeves and create a software engineering model. Luckily, I found a webpage that provided a good user interface to tagging sentences and generated the json file used for training. I was patient enough to tag 200 lines with what I considered to be software specific named-entities. … and now I have broken the NER model I built…
The following plot shows the growth in the total number of named-entities appearing in the changelog, and the number of unique named-entities (with the 1,996 numbers and dates removed; code+data);
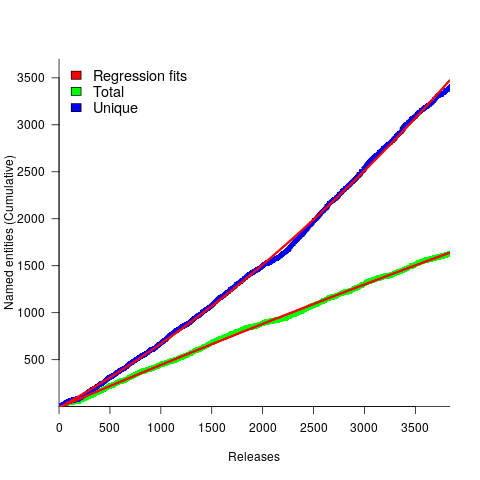
The regression fits (red lines) are quadratics, slightly curving up (total) and down (unique); the linear growth components are: 0.6 per release for total, and 0.46 for unique.
Including software named-entities is likely to increase the total by at least 15%, but would have little impact on the number of unique entries.
This extraction pipeline processes one release line at a time. Building a set of Beeminder tag-names requires analysing the changelog as a whole, which would take a lot longer than the day spent on this analysis.
The Beeminder developers have consistently added new named-entities to the changelog over more than eleven years, but does this mean that more features have been consistently added to the software (or are they just inventing different names for similar functionality)?
It is not possible to answer this question without access to the code, or experience of using the product over these eleven years.
However, staying in business for eleven years is a good indicator that the developers are doing something right.
Join a crowdsourced search for software engineering data
Software engineering data, that can be made publicly available, is very rare; most people don’t attempt to collect data, and when data is collected, people rarely make any attempt to hang onto the data they do collect.
Having just one person actively searching for software engineering data (i.e., me) restricts potential sources of data to be English speaking and to a subset of development ecosystems.
This post is my attempt to start a crowdsourced campaign to search for software engineering data.
Finding data is about finding the people who have the data and have the authority to make it available (no hacking into websites).
Who might have software engineering data?
In the past, I have emailed chief technology officers at companies with less than 100 employees (larger companies have lawyers who introduce serious amounts of friction into releasing company data), and this last week I have been targeting Agile coaches. For my evidence-based software engineering book I mostly emailed the authors of data driven papers.
A lot of software is developed in India, China, South America, Russia, and Europe; unless these developers are active in the English-speaking world, I don’t see them.
If you work in one of these regions, you can help locate data by finding people who might have software engineering data.
If you want to be actively involved, you can email possible sources directly, alternatively I can email them.
If you want to be actively involved in the data analysis, you can work on the analysis yourself, or we can do it together, or I am happy to do it.
In the English-speaking development ecosystems, my connection to the various embedded ecosystems is limited. The embedded ecosystems are huge, there must be software data waiting to be found. If you are active within an embedded ecosystem, you can help locate data by finding people who might have software engineering data.
The email template I use for emailing people is below. The introduction is intended to create a connection with their interests, followed by a brief summary of my interest, examples of previous analysis, and the link to my book to show the depth of my interest.
By all means cut and paste this template, or create one that you feel is likely to work better in your environment. If you have a blog or Twitter feed, then tell them about it and why you think that evidence-based software engineering is important.
Be responsible and only email people who appear to have an interest in applying data analysis to software engineering. Don’t spam entire development groups, but pick the person most likely to be in a position to give a positive response.
This is a search for gold nuggets, and the response rate will be very low; a 10% rate of reply, saying sorry not data, would be better than what I get. I don’t have enough data to be able to calculate a percentage, but a ballpark figure is that 1% of emails might result in data.
My experience is that people are very unsure that anything useful will be found in their data. My response has been that I am always willing to have a look.
I always promise to anonymize their data, and not release it until they have agreed; but working on the assumption that the intent is to make a public release.
I treat the search as a background task, taking months to locate and email, say, 100-people considered worth sending a targeted email. My experience is that I come up with a search idea or encounter a blog post that suggests a line of enquiry, that may result in sending half-a-dozen emails. The following week, if I’m lucky, the same thing might happen again (perhaps with fewer emails). It’s a slow process.
If people want to keep a record of ideas tried, the evidence-based software engineering Slack channel could do with some activity.
Hello,

A personalized introduction, such as: I have been reading
your blog posts on XXX, your tweets about YYY,
your youtube video on ZZZ.

My interest is in trying to figure out the human issues
driving the software process.

Here are two detailed analysis of Agile estimation data:
https://arxiv.org/abs/1901.01621
and
https://arxiv.org/abs/2106.03679

My book Evidence-based Software Engineering discusses what is
currently known about software engineering, based on an
analysis of all the publicly available data.
pdf+code+all data freely available here:
http://knosof.co.uk/ESEUR/

and I'm always on the lookout for more software data.
This email is a fishing request for software engineering data.

I offer a free analysis of software data, provided an
anonymised version of the data can be made public.
Creating and evolving a programming language: funding
The funding for artists and designers/implementors of programming languages shares some similarities.
Rich patrons used to sponsor a few talented painters/sculptors/etc, although many artists had no sponsors and worked for little or no money. Designers of programming languages sometimes have a rich patron, in the form of a company looking to gain some commercial advantage, with most language designers have a day job and work on their side project that might have a connection to their job (e.g., researchers).
Why would a rich patron sponsor the creation of an art work/language?
Possible reasons include: Enhancing the patron’s reputation within the culture in which they move (attracting followers, social or commercial), and influencing people’s thinking (to have views that are more in line with those of the patron).
The during 2009-2012 it suddenly became fashionable for major tech companies to have their own home-grown corporate language: Go, Rust, Dart and Typescript are some of the languages that achieved a notable level of brand recognition. Microsoft, with its long-standing focus on developers, was ahead of the game, with the introduction of F# in 2005 (and other languages in earlier and later years). The introduction of Swift and Hack in 2014 were driven by solid commercial motives (i.e., control of developers and reduced maintenance costs respectively); Google’s adoption of Kotlin, introduced by a minor patron in 2011, was driven by their losing of the Oracle Java lawsuit.
Less rich patrons also sponsor languages, with the idiosyncratic Ivor Tiefenbrun even sponsoring the creation of a bespoke cpu to speed up the execution of programs written in the company language.
The benefits of having a rich sponsor is the opportunity it provides to continue working on what has been created, evolving it into something new.
Self sponsored individuals and groups also create new languages, with recent more well known examples including Clojure and Julia.
What opportunities are available for initially self sponsored individuals to support themselves, while they continue to work on what has been created?
The growth of the middle class, and its interest in art, provided a means for artists to fund their work by attracting smaller sums from a wider audience.
In the last 10-15 years, some language creators have fostered a community driven approach to evolving and promoting their work. As well as being directly involved in working on the language and its infrastructure, members of a community may also contribute or help raise funds. There has been a tiny trickle of developers leaving their day job to work full time on ‘their’ language.
The term Hedonism driven development is a good description of this kind of community development.
People have been creating new languages since computers were invented, and I don’t expect this desire to create new languages to stop anytime soon. How long might a language community be expected to last?
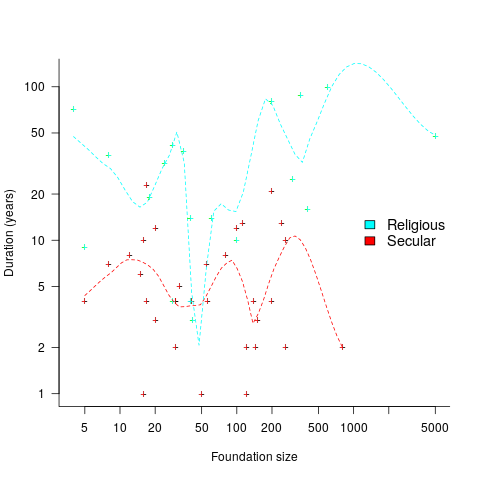
Having lots of commercially important code implemented in a language creates an incentive for that language’s continual existence, e.g., companies paying for support. When little or co commercial important code is available to create an external incentive, a language community will continue to be active for as long as its members invest in it. The plot below shows the lifetime of 32 secular and 19 religious 19th century American utopian communities, based on their size at foundation; lines are fitted loess regression (code+data):
How many self-sustaining language communities are there, and how many might the world’s population support?
My tracking of new language communities is a side effect of the blogs I follow and the few community sites a visit regularly; so a tiny subset of the possibilities. I know of a handful of ‘new’ language communities; with ‘new’ as in not having a Wikipedia page (yet).
One list contains, up until 2005, 7,446 languages. I would not be surprised if this was off by almost an order of magnitude. Wikipedia has a very idiosyncratic and brief timeline of programming languages, and a very incomplete list of programming languages.
I await a future social science PhD thesis for a more thorough analysis of current numbers.
Recent Comments