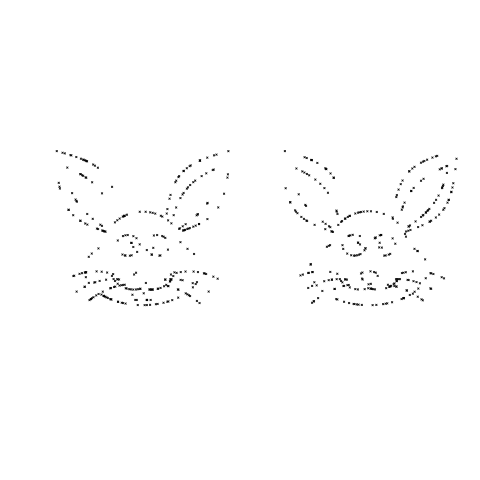
Automatically generated join-the-dots images
It is interesting to try and figure out what picture emerges from a join-the-dots puzzle (connect-the-dots in some parts of the world). Let’s have a go at some lightweight automatic generation such a puzzle (some heavy-weight techniques).
If an image is available, expressed as an boolean matrix, R’s sample function can be used to select a small percentage of the black points.
Taking the output of the following equation:
x=seq(-4.7, 4.7, by=0.002) y1 = c(1,-.7,.5)*sqrt(c(1.3, 2,.3)^2 - x^2) - c(.6,1.5,1.75) # 3 y2 =0.6*sqrt(4 - x^2)-1.5/as.numeric(1.3 <= abs(x)) # 1 y3 = c(1,-1,1,-1,-1)*sqrt(c(.4,.4,.1,.1,.8)^2 -(abs(x)-c(.5,.5,.4,.4,.3))^2) - c(.6,.6,.6,.6,1.5) # 5 y4 =(c(.5,.5,1,.75)*tan(pi/c(4, 5, 4, 5)*(abs(x)-c(1.2,3,1.2,3)))+c(-.1,3.05, 0, 2.6))/ as.numeric(c(1.2,.8,1.2,1) <= abs(x) & abs(x) <= c(3,3, 2.7, 2.7)) # 4 y5 =(1.5*sqrt(x^2 +.04) + x^2 - 2.4) / as.numeric(abs(x) <= .3) # 1 y6 = (2*abs(abs(x)-.1) + 2*abs(abs(x)-.3)-3.1)/as.numeric(abs(x) <= .4) # 1 y7 =(-.3*(abs(x)-c(1.6,1,.4))^2 -c(1.6,1.9, 2.1))/ as.numeric(c(.9,.7,.6) <= abs(x) & abs(x) <= c(2.6, 2.3, 2)) # 3 |
and sampling 300 of the 20,012 points we get images such as the following:

A relatively large sample size is needed to reduce the possibility that a random selection fails to return any points within a significant area, but we do end up with many points clustered here and there.
library("plyr")

rab_points=adply(x, 1, function(X) data.frame(x=rep(X, 18), y=c(
	c(1, -0.7, 0.5)*sqrt(c(1.3, 2, 0.3)^2-X^2) - c(0.6, 1.5 ,1.75),
	0.6*sqrt(4 - X^2)-1.5/as.numeric(1.3 <= abs(X)),
	c(1, -1, 1, -1, -1)*sqrt(c(0.4, 0.4, 0.1, 0.1, 0.8)^2-(abs(X)-c(0.5, 0.5, 0.4, 0.4, 0.3))^2) - c(0.6, 0.6, 0.6, 0.6, 1.5),
	(c(0.5, 0.5, 1, 0.75)*tan(pi/c(4, 5, 4, 5)*(abs(X)-c(1.2, 3, 1.2, 3)))+c(-0.1, 3.05, 0, 2.6))/
		as.numeric(c(1.2, 0.8, 1.2, 1) <= abs(X) & abs(X) <= c(3,3, 2.7, 2.7)),
	(1.5*sqrt(X^2+0.04) + X^2 - 2.4) / as.numeric(abs(X) <= 0.3),
	(2*abs(abs(X)-0.1)+2*abs(abs(X)-0.3)-3.1)/as.numeric(abs(X) <= 0.4),
	(-0.3*(abs(X)-c(1.6, 1, 0.4))^2-c(1.6, 1.9, 2.1))/
		as.numeric(c(0.9, 0.7, 0.6) <= abs(X) & abs(X) <= c(2.6, 2.3, 2))
						)))
rab_points$X1=NULL
rb=subset(rab_points, (!is.na(x)) & (!is.na(y) & is.finite(y)))

x=sample.int(nrow(rb), 300)
plot(rb$x[x], rb$y[x],
bty="n", xaxt="n", yaxt="n", pch=4, cex=0.5, xlab="", ylab="") |
A more uniform image can produced by removing all points less than a given distance from some selected set of points. In this case the point in the first element is chosen, everything close to it removed and the the processed repeated with the second element (still remaining) and so on.
rm_nearest=function(jp)
{
keep=((dot_im$x[(jp+1):(jp+window_size)]-dot_im$x[jp])^2+
      (dot_im$y[(jp+1):(jp+window_size)]-dot_im$y[jp])^2) < min_dist
keep=c(keep, TRUE) # make sure which has something to return
return(jp+which(keep))
}

window_size=500
cur_jp=1
dot_im=rb

while (cur_jp <= nrow(dot_im))
   {
#   min_dist=0.05+0.50*runif(window_size)
   min_dist=0.05+0.30*runif(1)
   dot_im=dot_im[-rm_nearest(cur_jp), ]
   cur_jp=cur_jp+1
   }

plot(dot_im$x, dot_im$y,
bty="n", xaxt="n", yaxt="n", pch=4, cex=0.5, xlab="", ylab="") |
Since R supports vector operations I want to do everything without using loops or if-statements. Yes, there is a while loop :-(, alternative, simple, non-loop suggestions welcome.
Removing points with an average squared distance less than 0.3 and 0.5 we get (with around 135-155 points) the images:

I was going to come up with a scheme for adding numbers, perhaps I will do this in another post.
Click for more equations generating images.
On the while loop for eliminating closely-spaced dots: Each pair of dots have an associated distance. In the set of dot-pairs with a distance of, say, less than 0.5, some dots will repeat if they have more than one near neighbor. So the goal is to eliminate the least number of dots that result in a null set of dot-pairs with distance less than 0.5.
It reminds me of network problems. Think spoke-and-wheel representing a dot in the center and all its neighbors as the spokes. Trim the spokes that are longer than 0.5. Then for wheels that still have spokes, eliminate the center dot. I think that might eliminate the least number of closely spaced dots. And because you can treat each wheel separately, it could be done iteratively. You might run into problems with the initial network representation, though, because you want each dot represented only once. Otherwise you end up deleting both dots in a pair.
There are some R packages that deal with network representations that might be helpful. I haven’t really explored them in much detail.